Single-Candle Signals in Context — Location, Confirmation, and Failure
The same long-shadow shape produces opposite signals depending on where it appears. This lesson shows hammer, hanging man, shooting star, inverted hammer, spinning top, and high-wave candle in realistic price sequences — with confirmation, non-confirmation, and failure cases.
- Identify a hammer and distinguish it from a hanging man in a price sequence by location alone
- Explain why the hanging man requires confirmation more than any other single-candle pattern
- Distinguish an inverted hammer from a shooting star by prior trend context
- Apply the three-step read — shadows for who fought, body for who won, location for what it means — to any indecision candle
- Explain why a spinning top mid-trend is a pause and why a high-wave candle at a trend extreme is a sharper warning
Long-shadow singles — hammer, hanging man, shooting star
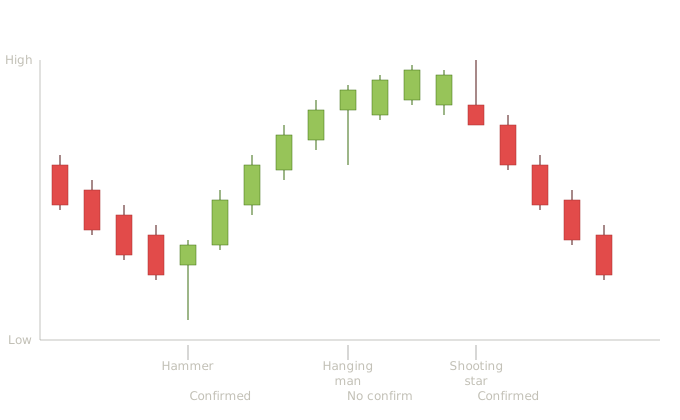
Hammer confirmed, hanging man unconfirmed, shooting star confirmed — same shape family, three different outcomes by location
Four bearish candles have pushed price into the chart's low, establishing the downtrend context the pattern requires. The hammer's small body sits near the top of its range with a long lower shadow — sellers drove price well below the open during the session, but buyers absorbed the selling and pushed the close back up. The next session is a long bullish candle that closes well above the hammer's body — confirmation present. Recovery follows. Real-world takeaway: the location is what made this hammer tradeable. Without four prior bearish sessions establishing exhaustion, the same shape would just be a candle with a tail.
After the recovery, price rallies into a new high. The hanging man has the identical shape to the hammer — small body, long lower shadow, little or no upper shadow — but appears at the top of an advance rather than the bottom of a decline. The interpretation flips: the long lower shadow now means sellers tested the downside for the first time during this advance, which is a warning. The next candle is another bullish candle continuing the rally — no confirmation arrived. The pattern fails and the uptrend continues. Real-world takeaway: the hanging man requires confirmation more than most patterns. Trading it on appearance alone is a frequent beginner mistake because the long lower shadow can look bullish on its own. Always wait for the next candle to close below the hanging man's body before acting.
Price advances further before the shooting star forms. Small body near the bottom of the range, long upper shadow — buyers pushed price significantly higher during the session and couldn't hold it. Sellers recovered the entire intraday rally by the close. The next candle gaps down and continues lower — confirmation present. The reversal follows. Real-world takeaway: the shooting star is most reliable at the top of an extended advance, especially when the upper shadow tests a resistance level that wasn't shown on this chart. Students should specifically watch for it when a rally looks tired and the session opens, rallies aggressively, and gives back the gains.
The three patterns illustrate the most important interpretive principle in candlestick analysis: shape alone does not determine signal. Hammer and hanging man are the identical shape — the only difference is where in the trend they appear. Shooting star and inverted hammer are similarly identical shapes distinguished only by location. Students who memorize shapes without location will misread every signal. The chart also models the confirmation discipline. The hammer was confirmed and worked. The hanging man was unconfirmed and failed — exactly as it often does. The shooting star was confirmed and worked. Confirmation isn't decoration; it's the filter that separates tradeable signals from premature entries.
Inverted hammer plus small-body family — spinning top, high-wave
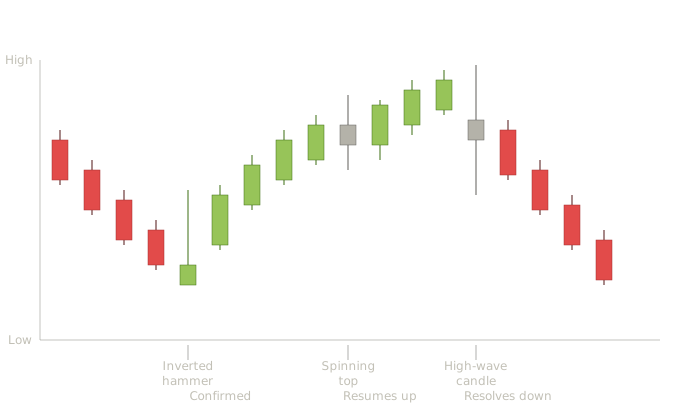
Inverted hammer confirmed, spinning top mid-trend pause, high-wave candle at top — indecision spectrum
Four bearish candles establish the downtrend. The inverted hammer has a small body near the bottom of its range and a long upper shadow — buyers pushed price significantly higher during the session, but couldn't hold the gains and the close drifted back near the open. The pattern looks weak on its own (the close didn't hold the highs), which is why confirmation matters more here than for the standard hammer. The next session is a long bullish candle that closes well above the inverted hammer's body — confirmation present. Recovery follows. Real-world takeaway: the inverted hammer is the weaker cousin of the standard hammer because the close didn't reflect buyer victory — only the intraday push did. Always wait for the next session to confirm with a higher close before treating this pattern as actionable.
During the recovery, a spinning top appears. Small body in the middle of the range, with upper and lower shadows both longer than the body. Both sides fought during the session and neither won — momentum has paused. The next candle is bullish and the uptrend resumes. Real-world takeaway: spinning tops are pause indicators, not reversal signals. The mistake students make is treating every spinning top as a reversal warning. Most resolve in the direction of the prior trend, especially mid-trend where they appear as natural breathing room. They become more interesting at trend extremes, where they may signal exhaustion.
Toward the top of the advance, a high-wave candle appears. Like a spinning top but with exceptionally long shadows in both directions — the session saw extreme volatility before resolving to near-neutral. This is a much sharper warning than the spinning top because the magnitude of indecision is far greater. The next session is a long bearish candle that breaks the rally and starts a decline. Real-world takeaway: high-wave candles often precede directional resolutions because the underlying conflict they show is unsustainable. When buyers and sellers fight that hard in a single session, one side typically loses the next session decisively. Direction must be inferred from confirmation, not from the high-wave candle itself.
The three patterns form a spectrum of indecision intensity. The inverted hammer is directional indecision — buyers tried, failed to hold, but the location says reversal is possible. The spinning top is symmetric indecision in the middle of a trend, which usually means continuation. The high-wave candle is symmetric indecision at extreme magnitude, which usually means imminent resolution but doesn't tell you which direction. The shared interpretive habit being trained: read the shadows for who fought, read the body for who won, read the location for what the outcome means. Same three-step process for every indecision candle, regardless of which family member it belongs to.
Key Takeaways
- Hammer and hanging man are the identical shape — location alone determines which one it is and what it means. Same for inverted hammer and shooting star
- The hanging man fails without confirmation more than almost any other pattern — always wait for the next candle to close below the body before acting
- The inverted hammer is weaker than the standard hammer because the close is at the bottom of the range, not the top. Confirmation is more important, not less
- Spinning tops mid-trend are pauses, not reversals — most resolve in the direction of the prior trend. They become more significant only at trend extremes
- High-wave candles at trend extremes signal unsustainable conflict — one side typically wins decisively in the next session. Direction requires confirmation to determine
Quiz — 3 Questions
Answer one at a timeThe same long-lower-shadow candle appears twice in the same chart — once after four bearish sessions, once after a five-session rally. How should you name and interpret each?