Two-Candle Patterns in Context — Engulfing, Harami, and the Piercing Spectrum
Knowing the definitions is not enough. This lesson shows every two-candle pattern family inside a realistic price sequence — with working signals, failed signals, and the failure case that students most commonly misread.
- Distinguish a valid engulfing pattern from an engulfing-shaped candle in sideways action
- Explain why magnitude on the engulfing candle determines signal quality, not just structure
- Explain why a harami is a condition and how confirmation converts it into a signal
- Identify the failure case for the harami — the structurally correct pattern that the market rejects one session later
- Explain why the midpoint threshold separates the piercing pattern from a continuation candle
Engulfing patterns — bullish engulfing, bearish engulfing, with failed engulfing
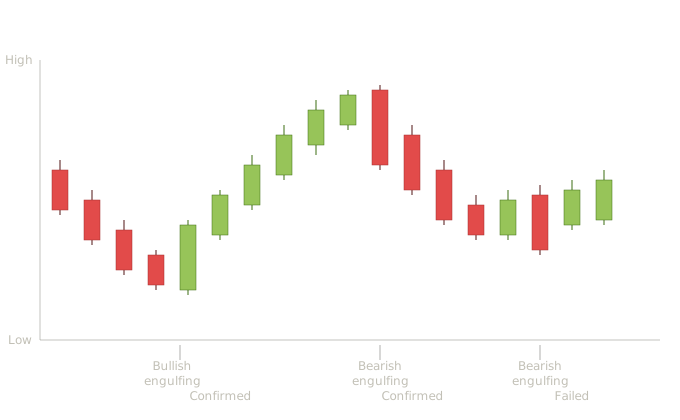
Bullish engulfing confirmed, bearish engulfing confirmed, and failed engulfing in sideways action
Three bearish candles establish the downtrend, followed by a small bearish candle that hints at slowing momentum. Then the bullish engulfing forms — a long bullish candle whose body completely contains the prior small bearish body. The open is below the prior close and the close is well above the prior open. The buyer's session has reversed everything sellers accomplished the day before. The next session is another bullish candle that closes higher still — confirmation present. The recovery follows and the trend reverses. Real-world takeaway: notice the magnitude. The engulfing candle is dramatically larger than the small bearish candle it engulfs, which strengthens the signal. Engulfing patterns where the second candle is barely larger than the first are weak versions of the pattern — students should learn to distinguish strong engulfing (clear size difference) from technically-correct-but-weak engulfing.
After the recovery, price rallies into a new high. A small bullish candle marks the final push, then the bearish engulfing forms — a long bearish candle whose body completely contains the prior small bullish body. Sellers have erased the prior session's progress in a single candle. The next session is another bearish candle that closes lower — confirmation present. The reversal follows. Real-world takeaway: the same magnitude principle applies. The engulfing candle here is large relative to the candle it engulfs, which gives the signal weight. Location matters too — this appeared at the top of an extended advance, not mid-trend, which means there was a real trend to reverse.
After the decline, price chops sideways. A bullish engulfing-shape candle appears, but notice the context: the candles around it are all similar size, all overlapping, with no clear trend in either direction. The 'engulfing' is structurally correct but interpretively meaningless — there's no trend to reverse. The next session is bullish, not bearish, and price continues drifting sideways. The pattern failed because location failed. Real-world takeaway: this is the single most common mistake students make with engulfing patterns. They identify the shape correctly but ignore the location requirement. An engulfing pattern needs a prior trend to reverse — without one, the same shape is just two overlapping candles signifying nothing.
The three examples drive home that engulfing patterns are location-dependent reversal signals, not standalone shapes. The bullish engulfing worked because it appeared at the bottom of a sustained decline. The bearish engulfing worked because it appeared at the top of a sustained advance. The third engulfing failed because there was no trend to reverse. Same shape, three different outcomes, determined by what came before. The interpretive habit being trained: before identifying any engulfing pattern, ask 'what trend is this pattern reversing?' If you can't answer that question clearly, the pattern isn't a signal — it's just two overlapping candles.
Harami family — harami, harami cross, and a failed harami
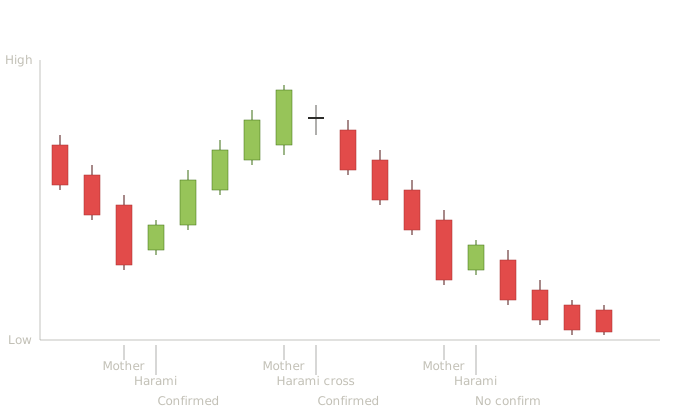
Bullish harami confirmed, harami cross confirmed, and failed harami — conditions that do and don't become signals
Three bearish candles establish the downtrend, with the third candle (the 'mother') being particularly long — a strong continuation of selling that ironically often marks exhaustion. The next session is the harami itself: a small bullish candle whose entire body sits inside the prior bearish body. The small candle's open is above the mother's close, and its close is below the mother's open. Sellers couldn't push through the prior session's range. The next session is a long bullish candle that closes above the harami's high — confirmation present. Recovery follows. Real-world takeaway: the harami is fundamentally a pause signal. The small inside candle doesn't reverse anything on its own — it just shows that selling pressure has stopped extending. Confirmation is what converts the pause into a reversal. Students who trade harami patterns without waiting for confirmation get whipsawed frequently.
After the recovery, price rallies. A long bullish candle marks the final push (the mother). The next session opens inside the mother's body and closes at essentially the same price — a doji sitting inside the prior body. This is the harami cross, and it's structurally similar to the harami but with sharper indecision. The doji says not just 'buyers paused' but 'the session reached open-equals-close stalemate.' The next session is a long bearish candle closing well below the harami cross's range — confirmation present. The reversal follows. Real-world takeaway: the harami cross is generally regarded as a stronger version of the harami because the doji signals more definitive loss of momentum than a small-bodied candle. Same confirmation rule applies — wait for the next session to break the small candle's range before acting.
During the decline, a bullish harami forms again. A long bearish candle (the mother), followed by a small bullish candle sitting inside its body. Structurally identical to the first harami in this chart. But the next session is another bearish candle, closing below the harami's low — no confirmation arrived. The decline continues. Real-world takeaway: this is the failure case students need to internalize. The shape is correct. The location is even similar to the first example. But the pattern fails. Why? Because the harami alone is not a signal — it's a candidate. Without confirmation, it's just a quiet session inside a noisy one. The market revealed within one more session that selling pressure hadn't actually exhausted; it had just rested for a day.
The harami family teaches one of the most important interpretive lessons in candlestick analysis: some patterns are conditions, not signals. A harami creates the condition for a reversal but does not itself reverse anything. The next session is what determines whether the condition matured into a real shift or dissolved back into the prevailing trend. The discipline being trained here is patience. Engulfing patterns are loud — the second candle reverses everything the first did, and the signal is essentially built in. Harami patterns are quiet — the second candle does almost nothing, and that nothingness has to be followed by something definitive before it means anything. Students who learn to wait one extra session on harami patterns will save themselves significant whipsaws. The harami cross is the family's strongest member because the doji adds sharpness to the indecision. But even the harami cross requires confirmation. Pattern strength affects how often confirmation arrives, not whether confirmation is needed.
Piercing pattern and dark cloud cover
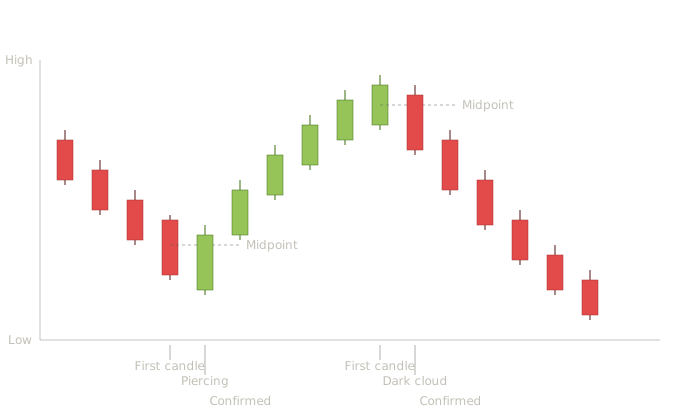
Piercing pattern and dark cloud cover — the midpoint threshold that separates reversal from continuation
Four bearish candles establish a clear downtrend. The fourth candle is particularly long — a session of strong selling that often precedes exhaustion. Notice the dashed midpoint line drawn across the body of this first candle; that's the key reference for the pattern. The next session opens with a downside gap (the bullish candle's open is below the prior candle's low) and then rallies strongly throughout the session to close above the first candle's midpoint. The gap-down open looks bearish initially, but the strong intraday recovery shows buyers absorbing the seller pressure and pushing back into the prior session's body. The next candle is another bullish candle closing higher — confirmation present. Recovery follows. Real-world takeaway: the midpoint penetration is the defining feature. A bullish candle that only penetrates a third of the prior body is a thrusting line — much weaker. A bullish candle that completely engulfs the prior body is a bullish engulfing pattern — generally stronger. The piercing pattern sits between them on the strength spectrum, and the midpoint is the threshold that defines it.
Four bullish candles establish the rally, with the fourth being a strong bullish push. The next session opens with an upside gap (the bearish candle's open is above the prior candle's high) — initially looking very bullish — then sells off throughout the session to close below the first candle's midpoint. The gap-up open trapped late buyers; the intraday reversal showed sellers taking control decisively. The next candle is another bearish candle closing lower — confirmation present. The reversal follows. Real-world takeaway: dark cloud cover is the mirror of the piercing pattern, and the same midpoint rule applies. A bearish candle that only dips a third into the prior body isn't dark cloud cover — it's an in-neck or thrusting line, which is bearish continuation, not reversal. The midpoint threshold is what distinguishes a reversal candidate from a continuation candle.
Piercing pattern and dark cloud cover both depend on gap-then-reverse mechanics. The gap in the direction of the prior trend is what makes the subsequent reversal meaningful — late entrants got caught on the wrong side, and their forced exits add fuel to the reversal. A bullish candle that simply opens higher than the prior close and closes well up isn't a piercing pattern; the gap-down open is part of the pattern's definition. The interpretive habit being trained: read the open carefully, not just the close. Many two-candle reversal patterns are defined by where the second candle opens relative to the first. Students who focus only on closes will misclassify piercing patterns as engulfing patterns, dark cloud cover as bearish engulfing, and so on. The opens encode the trap — and the trap is part of why these patterns work.
Key Takeaways
- Engulfing patterns need a prior trend — the same shape in sideways action is two overlapping candles that mean nothing. Always ask what trend the pattern is reversing before acting
- Magnitude matters on engulfing patterns — a second candle barely larger than the first is technically valid but practically weak. A dramatically larger engulfing candle is a different signal
- The harami is a condition, not a signal. The small inside candle shows selling has paused, not reversed. Confirmation from the next candle is what converts the pause into a trade
- The harami failure case: structurally correct pattern, correct location, no confirmation — the decline resumes. The shape was right; the market said no. Confirmation is not optional
- The piercing pattern and dark cloud cover are defined by the open, not just the close. The gap-then-reverse mechanic is the pattern — a candle without the gap is not the same pattern
Quiz — 3 Questions
Answer one at a timeA bullish engulfing appears in sideways, choppy price action where multiple recent candles are all overlapping in size. The next session is bearish. What is happening?