What Is a Candle — Trading Session, OHLC, Real Body, and Shadows
Every candlestick encodes exactly four prices from a single time window. Learn to read those four numbers — and what the visual shape they produce tells you about who controlled that session.
- Define a trading session and explain what a single candle represents
- Name and define the four OHLC prices
- Identify the real body, upper shadow, and lower shadow on any candlestick
- Distinguish a bullish candle from a bearish candle
- Define a marubozu and explain why the absence of shadows is significant
Foundations — What a Candle Is
Trading session — A defined time window (one day, one hour, five minutes) that a single candle represents. The candle summarizes everything that happened to price during that window.
- Open — The first traded price of the session.
- High — The highest traded price during the session.
- Low — The lowest traded price during the session.
- Close — The final traded price of the session.
These four numbers (OHLC) are everything a candle encodes. Here's how they map to the visual:
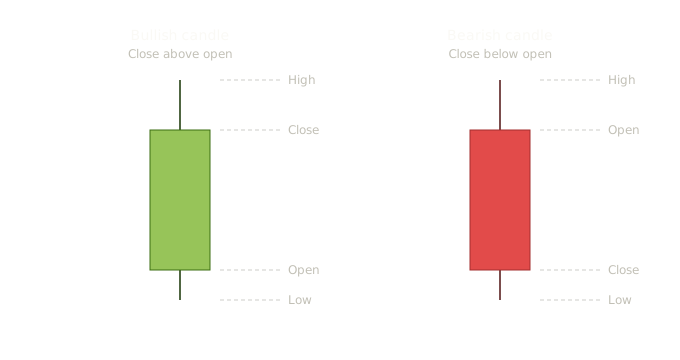
Bullish and bearish candle anatomy — Open, High, Low, Close mapped to real body, upper shadow, and lower shadow
Body and Shadows
- Real body — The thick rectangular part of the candle. It spans from open to close. Its height shows how far price moved between the start and end of the session.
- Bullish candle — A candle whose close is higher than its open. Price ended the session higher than it began. Conventionally drawn white, green, or hollow.
- Bearish candle — A candle whose close is lower than its open. Price ended the session lower than it began. Conventionally drawn black, red, or filled.
- Upper shadow (also called upper wick or upper tail) — The thin line extending above the real body, from the top of the body to the high.
- Lower shadow (also called lower wick or lower tail) — The thin line extending below the real body, from the bottom of the body to the low.
- Range — The total distance from low to high. The full vertical span of the candle.
Reading Proportions
The relationship between body size and shadow size carries meaning. These next terms describe candles whose proportions tell a story:
- Long-bodied candle — A candle with a tall real body relative to recent candles. Indicates strong directional conviction during the session.
- Short-bodied candle — A candle with a small real body. Indicates that open and close were near each other — little net progress despite whatever the shadows show.
- Marubozu — A candle with no shadows (or nearly none). The open and close occur at the extremes of the range. A bullish marubozu opens at the low and closes at the high; a bearish marubozu opens at the high and closes at the low. Represents one-sided control of the session.
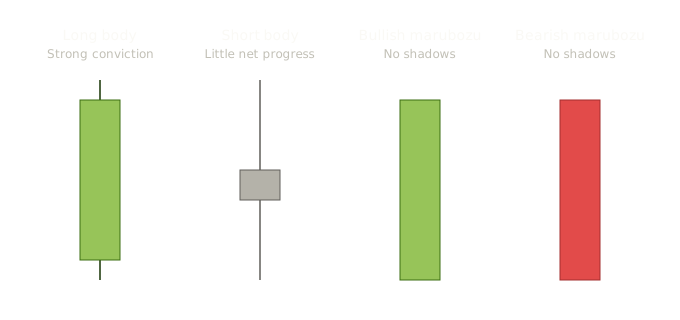
Long-bodied candle, short-bodied candle, bullish marubozu, and bearish marubozu — reading body proportions and shadow presence
Marubozu — Pattern Reference
| Confirmation | Volume | Reliability | Common Failure Mode |
|---|---|---|---|
| Marubozu is itself a confirmation candle in many patterns. As a standalone signal, the next candle continuing in the same direction confirms. | Heavy volume is expected and strengthens the signal. Light-volume marubozu suggests thin trading rather than conviction. | As a standalone reversal signal, modest. As confirmation within other patterns (engulfing, morning star, three white soldiers), strong. | A marubozu at trend extreme that gets immediately reversed — exhaustion can look identical to conviction in real time. |
Bearish marubozu: Liberated Stock Trader's testing shows a 56.1% winner rate with 0.80% profit per trade — 20-year Dow backtest. No isolated large-sample published figure for the standalone bullish marubozu. Multi-source pool for students to consult: thepatternsite.com (Bulkowski) — most extensive single source, methodology measures 10-day post-breakout performance; liberatedstocktrader.com (Barry D. Moore) — 20-year backtest on Dow components, reports win rate and profit per trade; quantifiedstrategies.com — independent backtest framework covering 75 patterns with explicit rule definitions; Google Scholar / SSRN — academic literature with transaction-cost adjustments.
Key Takeaways
- Trading session — A defined time window (one day, one hour, five minutes) that a single candle represents
- Every candle encodes exactly four prices: Open (first trade), High (session peak), Low (session trough), Close (final trade)
- Real body spans Open to Close. Bullish candle: close above open. Bearish candle: close below open
- Upper shadow spans body top to High. Lower shadow spans body bottom to Low
- Marubozu: no shadows — open at the extreme, close at the opposite extreme. Represents one-sided control of the session
Quiz — 3 Questions
Answer one at a timeA candle has Open = $50, High = $58, Low = $46, Close = $55. What color is this candle and where is the Open on the real body?