Single-Candle Signals — Long Shadows and Small Bodies
Hammer and hanging man are the identical shape. Inverted hammer and shooting star are the identical shape. The pattern's name follows its location. Shape alone does not determine a signal.
- Describe the structural definition of a hammer and a hanging man
- Explain why the hammer and hanging man are identical in shape but opposite in implication
- Describe the structural definition of an inverted hammer and a shooting star
- Apply the location rule to identify which signal a long-shadow candle is producing
- Define a spinning top and a high-wave candle and explain what each signals
Single-Candle Signals with Long Shadows
Now that you understand body and shadow, two more candle shapes carry meaning on their own:
- Hammer — A candle with a small real body near the top of the range and a long lower shadow (typically at least twice the body's height), with little or no upper shadow. The shape suggests sellers drove price down during the session but buyers absorbed the selling and pushed price back up. Read as a potential bullish signal when it appears after a downtrend.
- Hanging man — Identical shape to a hammer, but appearing after an uptrend. Same long lower shadow, small body near the top. The interpretation flips: the long lower shadow suggests sellers tested the downside for the first time in the recent move, which can warn of weakening upward momentum.
- Inverted hammer — A small real body near the bottom of the range with a long upper shadow and little or no lower shadow. Buyers pushed price up during the session but couldn't hold the gains. Read as a potential bullish signal when it appears after a downtrend.
- Shooting star — Identical shape to an inverted hammer, but appearing after an uptrend. The long upper shadow shows buyers tried to push higher and failed, which can warn of an exhausted advance.
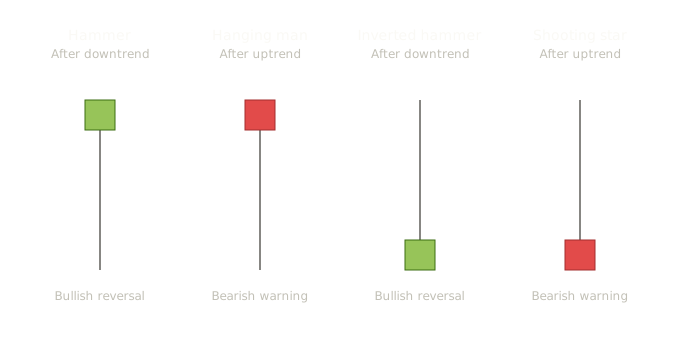
Hammer, hanging man, inverted hammer, and shooting star — same shape families distinguished only by location in the prior trend
The shape alone doesn't determine the signal — prior trend context is required. A hammer in an uptrend is not a hammer; it's a hanging man. The pattern's name follows its location.
Spinning Tops and Small-Body Candles
- Spinning top — A candle with a small real body and upper and lower shadows that are both longer than the body. Unlike a doji (where open equals close), a spinning top has a visible body — but the body is small relative to the shadows. Indicates that both sides fought during the session and neither won decisively. A pause in momentum.
- High-wave candle — A spinning top with exceptionally long shadows on both sides. Signals an even sharper loss of directional conviction — extreme volatility within the session that resolved to near-neutral.
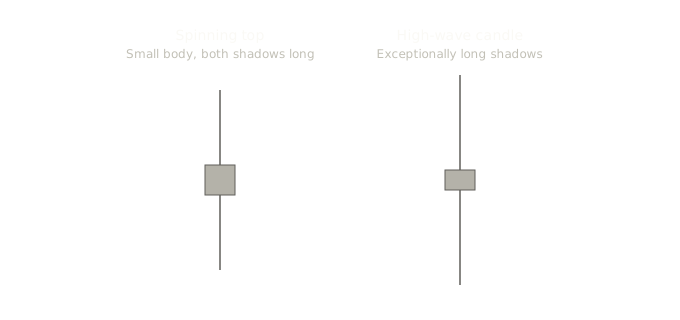
Spinning top and high-wave candle — the indecision spectrum from momentum pause to extreme stalemate
Single-Candle Signals — Pattern Reference
| Pattern | Confirmation | Volume | Reliability | Common Failure Mode |
|---|---|---|---|---|
| Hammer | Next candle closes above the hammer's high, or at minimum above the hammer's body. Strong confirmation: a long bullish candle following. | Hammer formed on above-average volume is more trustworthy — heavy volume on the lower shadow indicates real selling that was absorbed, not just thin trading. | Widely considered one of the more recognized single-candle reversal signals when location is strong. Less reliable in isolation than when at support. | Forms in the middle of a downtrend with no support nearby, then continues lower. Also fails when the body is too large relative to the shadow — that's not really a hammer, it's just a candle with a tail. |
| Hanging man | Next candle closes below the hanging man's body, ideally below its low. Without confirmation, this pattern is widely regarded as unreliable. | Heavy volume on the hanging man strengthens the signal — it suggests real selling tested the downside even though buyers recovered. | Generally considered less reliable than the hammer. Requires confirmation more than most patterns do. | Frequent. The uptrend often resumes the next session. Trading hanging men without confirmation is a classic beginner mistake. |
| Inverted hammer | Next candle closes above the inverted hammer's body. Without follow-through, the failed upside push it represents tends to reassert. | Above-average volume during the session signals real buying interest behind the upper shadow. | Generally considered less reliable than the hammer because the close is at the bottom of the range, not the top. Confirmation matters more. | The bearish trend resumes the next session because the candle closed near its low — the buying didn't hold. |
| Shooting star | Next candle closes below the shooting star's body, ideally with a gap down. | Heavy volume on the upper shadow strengthens the signal — buyers tried in force and failed in force. | A more recognized reversal signal when location is strong (after an extended uptrend with the high touching resistance). | Forms during a strong trend with no resistance overhead and is overrun the next session. |
| Spinning top | Next candle's direction resolves the indecision. | Light volume confirms the indecision read; heavy volume on a spinning top is more ambiguous. | A pause indicator, not a directional signal. Reliability is in identifying the pause, not predicting the resolution. | Treating it as a reversal signal when it's actually a continuation pause. |
Hammer: Bulkowski's testing shows 60% bullish reversal rate, reversal rank 26 out of 103. Barry D. Moore (Liberated Stock Trader, 20-year Dow backtest): 52.1% win rate with average profit of 0.18% per trade, negative Sharpe ratio of -0.05 — a notably less favorable result. Same pattern, two methodologies, materially different conclusions. Inverted hammer: Barry D. Moore backtest of 1,702 trades over 20 years shows a success rate of about 60% with profit of about 1.12% per trade. QuantifiedStrategies's SPY backtest produced 132 trades with a win ratio of 53–65% depending on whether exit was 1 to 10 trading days. Liberated Stock Trader's testing of 25 candle formations on 30 Dow Jones stocks over 20 years (56,680 trades, 10,199 years of data) ranks the inverted hammer as the most reliable candle pattern in their study, with 1.12% profit per trade and a 60% success rate. Three independent sources all land in the 53–65% range — that convergence is more meaningful than any single number. Shooting star: Bulkowski's testing shows the shooting star acts as a reversal 59% of the time, overall performance rank 55 out of 103 — he describes this as 'near random' performance. Liberated Stock Trader: 57.1% winner rate with 0.56% profit per trade. Multi-source pool: thepatternsite.com (Bulkowski), liberatedstocktrader.com (Barry D. Moore), quantifiedstrategies.com, Google Scholar / SSRN.
Key Takeaways
- Hammer — small real body near the top, long lower shadow. After a downtrend: potential bullish reversal. After an uptrend: hanging man (potential bearish warning). Same shape, opposite signals by location
- Inverted hammer — small real body near the bottom, long upper shadow. After a downtrend: potential bullish signal. After an uptrend: shooting star (potential bearish reversal)
- The pattern's name follows its location. A hammer in an uptrend is not a hammer — it's a hanging man
- Spinning top: small real body with upper and lower shadows both longer than the body. A pause in momentum. High-wave: a spinning top with exceptionally long shadows on both sides — sharper loss of directional conviction
- Hanging man and inverted hammer require confirmation more than their counterparts — the next candle must close in the reversal direction before acting
Quiz — 3 Questions
Answer one at a timeA candle has a small real body near the top of the range, a long lower shadow, and almost no upper shadow. Price has been rising for five sessions before this candle. What is this pattern called?