Continuation Patterns in Context — Rising Three Methods, Upside Tasuki Gap, and Falling Three Methods
Chart 11 puts the continuation pattern family into a realistic price sequence — showing how each pattern appears, confirms, and why the middle candles that look like reversals are actually the pattern's structural requirement.
- Read a rising three methods in a price sequence and identify whether the middle candles stayed within the first candle's range
- Identify an upside tasuki gap and determine whether the gap was respected or filled
- Read a falling three methods and explain what the three small bullish candles represent structurally
- Apply the bounded counter-trend rule to distinguish healthy pullbacks from developing reversals
Continuation patterns — rising three methods, falling three methods, upside tasuki gap
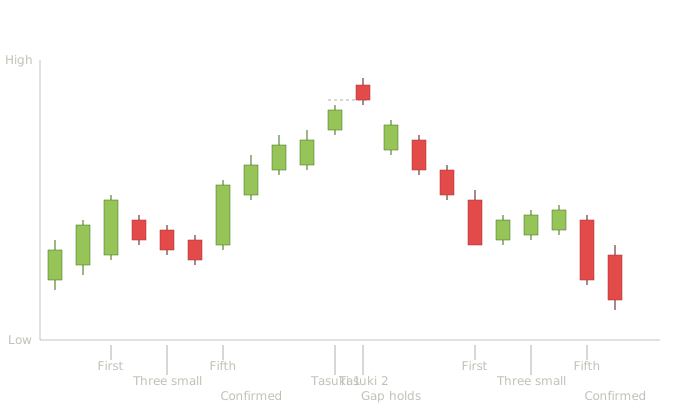
Rising three methods, falling three methods, and upside tasuki gap — continuation patterns in market context
Two early bullish candles establish the uptrend, then the pattern begins. The first candle is a long bullish session — strong buying with conviction. The next three sessions are small bearish candles that drift downward, each staying within the range of the first candle. The pullback is orderly, not panicked. The fifth candle is another long bullish candle that closes above the first candle's close, breaking out of the consolidation to new highs. The next session continues higher — confirmation present. The uptrend resumes. Real-world takeaway: the three middle candles look bearish in isolation, which is why students often misread the pattern as the start of a reversal. The structural rule that the middle candles stay within the first candle's range is what reveals it as healthy consolidation rather than distribution. Volume matters here — heavy volume on the first and fifth candles with light volume on the three middle candles is the constructive signature.
As the uptrend continues, two bullish candles form with an upward gap between them. The next session is a bearish candle that opens within the second bullish candle's body and sells off — but the close lands within the gap, not below it. The gap remains partially intact. The following sessions resume higher — gap holds, continuation confirmed. Real-world takeaway: the key feature is that the gap is not fully filled. If the bearish third candle had closed below the first bullish candle's high, the gap would have closed and the continuation signal would be invalidated. Students should watch the gap as the structural test — gap holds means continuation, gap fills means the pattern has failed.
After the rally exhausts and a downtrend establishes, the falling three methods forms. A long bearish candle leads, followed by three small bullish candles drifting upward within the first candle's range, followed by a long bearish candle closing below the first candle's low. The next session continues lower — confirmation present. The downtrend resumes. Real-world takeaway: the three small bullish candles are the trap. Students who entered long during the small bullish drift get caught when the fifth candle resolves the pattern decisively in the downtrend's direction. The pattern's value isn't predicting the trend — the trend was already established — but predicting that the pullback is shallow rather than reversal.
Continuation patterns teach a discipline that reversal patterns can't: recognizing healthy pullbacks. Most students learn to spot reversals first and develop pattern-recognition habits oriented toward identifying turning points. But trends spend most of their time in continuation, not reversal, and reading pullbacks as continuation candidates rather than reversal candidates is where consistent trend traders make their living. The structural rule that defines all three continuation patterns is the same: the counter-trend portion stays bounded by the prior trend candle's range. Rising three methods: the small bearish candles stay within the first long bullish candle's range. Falling three methods: the small bullish candles stay within the first long bearish candle's range. Upside tasuki gap: the bearish third candle doesn't close the gap. When the counter-trend move stays bounded, the trend hasn't actually been challenged — it's just paused. When the bound is broken, the pattern fails and reversal becomes possible.
Pattern statistics and sources
| Pattern | Confirmation | Volume | Reliability | Common Failure Mode |
|---|---|---|---|---|
| Rising three methods | Fifth candle closes beyond the first candle's close in the trend direction. | Heavy on first and fifth candles; light on the three middle candles. | Generally regarded as a respected continuation pattern when the structural rules and volume signature are present. | Middle candles drift outside the first candle's range. |
| Falling three methods | Fifth candle closes below the first candle's low. | Same signature as rising three methods. | Generally regarded as a respected continuation signal, though notably rare. | Same structural rule violation — middle candles exceed the first candle's range. |
| Upside tasuki gap | Subsequent sessions continue in the trend direction without fully filling the gap. | Higher on the gap candle, lower on the counter-trend third candle. | Generally regarded as modest standalone; useful primarily as a check on whether a gap is being respected. | Gap fills within a few sessions. |
| Downside tasuki gap | Same as upside tasuki gap in mirror. | Same signature as upside tasuki gap. | Same as upside tasuki gap. | Gap fills within a few sessions. |
Rising three methods: PatternsWizard's research across 4,120 markets found the rising three methods and falling three methods pattern confirms 74.5% of the time on average. The Robust Trader's backtest framework covers this pattern alongside 75 others and reports it as a reliable tool for predicting short-term price movements. Multi-source pool: thepatternsite.com, patternswizard.com, therobusttrader.com, quantifiedstrategies.com, academic Google Scholar searches. Falling three methods: Bulkowski's testing shows the falling three methods acts as a bearish continuation 71% of the time, with a reversal-rank of 7 (very high, where 1 is best). Frequency rank is 91 out of 103, meaning the pattern is rare. Overall performance ranks 89th, likely due to the small sample size of 64 instances found across 4.7 million candle lines studied. Teaching point: The 71% continuation rate and 74.5% confirmation rate from two different sources cluster well, but note the extreme rarity — students may go months without seeing the pattern. The combination of high reliability and low frequency makes this a wait-for-it pattern rather than a workhorse. Multi-source pool: same as rising three methods. Upside / downside tasuki gap: Multi-source pool: thepatternsite.com, quantifiedstrategies.com, patternswizard.com.
Key Takeaways
- Rising three methods: the three middle candles look bearish in isolation — the structural test is whether they stay within the first candle's range, not whether they look bearish
- Upside tasuki gap: the gap is the signal — gap holds means continuation, gap fills means the pattern has failed
- Falling three methods: the three small bullish candles are the trap — students who enter long during the drift get caught when the fifth candle resolves decisively lower
- The bounded counter-trend rule defines all three patterns: when the counter-trend move stays bounded, the trend hasn't been challenged — it's just paused
- When the bound is broken, the pattern fails and reversal becomes possible
Quiz — 3 Questions
Answer one at a timeIn the chart, three small bearish candles drift downward after a long bullish candle. All three stay within the first candle's range. The next candle is also small and bearish, but it closes slightly below the first candle's low. What has happened?