Kickers, Belt Holds, and Windows in Context — The Gap-Driven Signals
Kickers signal violent sentiment reversals. Belt holds signal one-sided session control. Windows create structural support and resistance that persists into future price action. Chart 14 shows all three in sequence.
- Identify a bullish kicker by its open-equal-open relationship and abrupt directional shift
- Identify a bullish belt hold by the absence of a lower shadow from the opening tick
- Identify a rising window and explain why the gap zone acts as future support on retest
- Apply the unifying principle: gaps are sentiment markers that carry information about what happened between sessions
Kickers, belt holds, and windows — the gap-driven signals
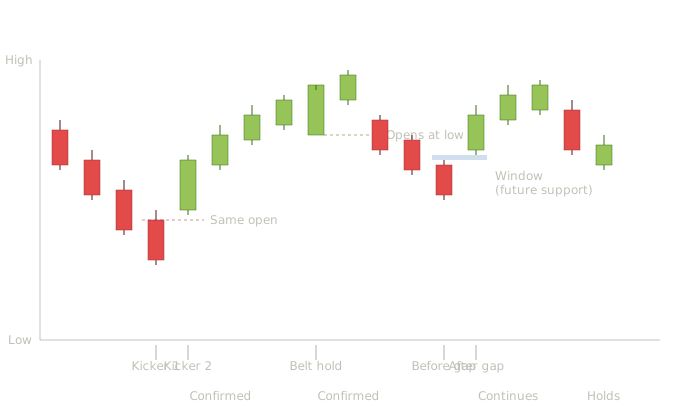
Bullish kicker, bullish belt hold, and rising window — three gap-driven signals in a realistic price sequence showing confirmation and the rising window acting as structural support
Four bearish candles drive price into a low. The first kicker candle continues the decline — another bearish session that gives no warning of what's about to happen. The next session opens at the same price as the prior candle's open (marked by the dashed red line — same opening price) and then rallies strongly throughout the day. The structural feature here is the open-equal-open relationship: there's no gap between the two opens, but the second candle moves immediately and powerfully against the first candle's direction. The next session continues higher — confirmation present. The reversal is abrupt and complete. Real-world takeaway: kickers are the most violent reversal patterns in the candlestick lexicon. They typically occur on news events, earnings surprises, or major sentiment shifts where the market essentially ignores everything that came before. The interpretive habit being trained: kickers don't need confirmation in the usual sense because the pattern itself is so decisive. The second candle's behavior — opening at the prior open and running hard in the opposite direction — represents a sentiment shift severe enough that follow-through is the high-probability outcome.
After two ordinary bullish candles continue the recovery, a belt hold appears. The candle opens at its low (no lower shadow — the dashed green line marks the open price coinciding with the low) and rallies strongly to close near its high. No sellers entered the session at any point; the open was the low. The next session continues higher — confirmation present. The rally extends. Real-world takeaway: the belt hold's signature is the missing shadow on one end. A bullish belt hold has no lower shadow because the open equaled the low. A bearish belt hold has no upper shadow because the open equaled the high. The missing shadow tells you that one side controlled the session from the opening tick. As a single-candle pattern, the belt hold is modest in reliability on its own, but the missing-shadow signature makes it a useful confluence factor with other signals.
Following the belt hold and a few more bullish sessions, a brief three-candle pullback forms. Then the rising window appears: the next bullish candle opens above the prior candle's high, leaving a clean gap between them. The shaded blue band marks the window — the price region that was skipped over. The next sessions continue higher, and importantly, when a later bearish candle drops into the window region, price holds at the window's lower edge and bounces — the window has acted as support. Real-world takeaway: the rising window's value isn't just as a continuation signal but as a future structural feature. The gap creates a price region where no trading occurred, and that region tends to act as support on subsequent retests. Students should mark windows on their charts and watch for price returning to them — those return tests are often high-probability entries because the window's structural integrity is being defended.
The three patterns illustrate what gaps mean in candlestick analysis. Kickers use gaps (or near-gaps) to signal violent sentiment reversals. Belt holds don't involve gaps between candles but use the absence of a shadow to signal one-sided control. Windows are gaps that create structural features which persist into future price action. The unifying principle: gaps are sentiment markers. They tell you something happened between sessions — news, earnings, overnight flow — that prevented price from trading continuously. The market's behavior around gaps tells you what that something means. A gap that holds (rising window, falling window) signals trend conviction. A gap that fills quickly signals the gap was an overreaction. A gap that becomes a structural support or resistance level signals that the price region was meaningful. The interpretive habit being trained: don't ignore gaps. Many students focus exclusively on the candles themselves and treat the spaces between them as inert. The spaces carry information. A trend with no gaps is orderly accumulation or distribution. A trend with frequent gaps is news-driven, emotional, and prone to sharp reversals. Reading both the candles and the spaces between them gives students a more complete picture than reading the candles alone.
Pattern statistics and sources
| Pattern | Confirmation | Volume | Reliability | Common Failure Mode |
|---|---|---|---|---|
| Bullish kicker | The pattern itself is generally regarded as sufficient signal because the second candle's behavior is so decisive. Further follow-through next session strengthens. | Heavy volume on the kicker candle is ideal and expected — kickers without volume support are suspect. | Generally regarded as a powerful signal when correctly formed, often appearing on news-driven moves. | In low-liquidity instruments, a "kicker" can be a single-session anomaly that reverses immediately. Misidentification is also common — students label many wide-range candles as kickers when they don't meet the strict open-equal-open requirement. |
| Bearish kicker | The pattern itself is generally regarded as sufficient signal. | Heavy volume on the kicker candle is ideal. | Mixed across sources — some testing finds it weaker than the bullish version. | Second candle closes above the opening gap, or the gap fills quickly. |
| Bullish belt hold | Next candle continues in the belt hold's direction. | Heavy volume during the belt hold's session strengthens the signal. | Generally regarded as modest standalone; useful primarily as a confluence factor. | The missing shadow is a single-session feature that doesn't always indicate sustained directional pressure. |
| Rising window | Subsequent sessions respect the gap as support; confirmation is structural — the window holds. | Heavy volume on the gap candle confirms the gap is meaningful rather than thin-trading noise. | Generally regarded as among the more reliable continuation signals when the window holds for several sessions. | Window fills within a few sessions, especially common with low-volume gaps. |
| Falling window | Subsequent sessions respect the gap as resistance. | Same signature as rising window. | Generally regarded as comparable to rising window in mirror. | Window fills within a few sessions. |
Bullish kicker: Strike.money references TradingWolf studies showing 75–80% reliability for bullish kicker setups, and notes QuantifiedStrategies also highlights it as one of the most profitable gap-driven formations. Multi-source pool: thepatternsite.com, quantifiedstrategies.com, litefinance.org, strike.money, navia.co.in. Bearish kicker: According to QuantifiedStrategies' candlestick study, the bearish kicker pattern shows a success rate of about 47%, making it weak when used alone. Teaching point: The bearish kicker's 47% reading from QuantifiedStrategies contrasts sharply with the 75–80% bullish kicker number from TradingWolf. Same pattern in mirror, materially different reliability. This is exactly the kind of asymmetry students need to see — many patterns don't perform identically in their bullish and bearish forms, and assuming symmetry leads to misallocated confidence. Multi-source pool: same as bullish kicker, plus quantifiedstrategies.com's specific bearish kicker entry. Bullish belt hold: Liberated Stock Trader's backtesting reports about 56–58% success for belt hold patterns, while TradingWolf places effectiveness slightly higher, around 60–62%, particularly when appearing after prolonged selling. Multi-source pool: liberatedstocktrader.com, strike.money, thepatternsite.com, quantifiedstrategies.com. Rising window: Over a 20-year period in the S&P 500, QuantifiedStrategies reports the rising window pattern showed a high efficiency rating in 31.59% of occurrences when tested over a 5-candlestick period. CandleScanner's research found that across 502 S&P 500 symbols over a 20-year date range, the rising window occurred in 5.73% of all candlestick occurrences, with average frequency of 61.1. Teaching point: The CandleScanner frequency statistic is useful for setting student expectations — windows appear roughly once every 60 trading sessions in their data, which is uncommon enough that students shouldn't expect to see them constantly but common enough to encounter regularly across multiple instruments. Multi-source pool: candlescanner.com, quantifiedstrategies.com, trendspider.com, luxalgo.com, synapsetrading.com. Falling window: Multi-source pool: same as rising window.
Key Takeaways
- Bullish kicker: the second candle opens at the same price as the first candle's open and runs powerfully against it — the open-equal-open relationship is the structural requirement; no gap is required between the candles
- Bullish belt hold: no lower shadow means the open equaled the low — one-sided buyer control from the first tick; modest standalone reliability but useful as confluence
- Rising window: the gap zone becomes future support; when price retraces and holds at the window's lower edge, the gap has been structurally defended
- Gaps are sentiment markers: a gap that holds signals conviction; a gap that fills signals the move was an overreaction; a gap that becomes support or resistance signals the price region was meaningful
Quiz — 3 Questions
Answer one at a timeA student sees a wide-range bullish candle after a downtrend. The candle opens above the prior candle's close but below the prior candle's open. Is this a bullish kicker?