Tweezers and Abandoned Baby in Context — Rare but Powerful
Tweezers are common but modest. Abandoned babies are rare but powerful. This chart puts both patterns into a realistic price sequence and shows how structural rigor determines reliability.
- Identify a tweezer bottom by its matching lows after a sustained downtrend
- Explain why a tweezer top can fail in the middle of an established uptrend
- Identify a bullish abandoned baby by its clean gap isolation on both sides of the doji
- Explain why rarity correlates with reliability in pattern analysis
- Apply the structural enforcement habit: distinguish a true abandoned baby from a morning star
Tweezers and abandoned baby — rare but powerful
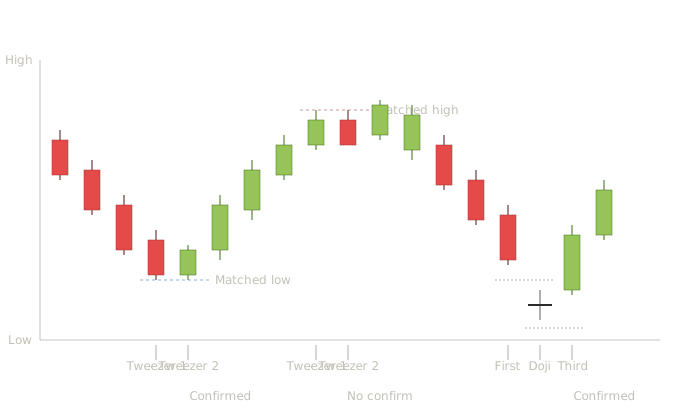
Tweezer bottom, tweezer top, and bullish abandoned baby — structural requirements and confirmation in a realistic price sequence
Four bearish candles drive price to a low. The fourth bearish candle establishes the floor — its low becomes the reference price. The next session is a small bullish candle that opens above the prior close, drops down during the session to test the exact same low as the prior candle, then rallies to close higher. The matching lows are the structural feature, marked by the dashed blue line. Sellers tested the same floor twice and failed both times. The next session is a long bullish candle closing well above the tweezer bottom — confirmation present. Recovery follows. Real-world takeaway: the matching lows are what makes this pattern meaningful. Sellers having two cracks at the same level and failing both times shows the level has real demand behind it. Students should look for the lows to be genuinely close — a few ticks apart is fine, but lows separated by a meaningful percentage of the range aren't a tweezer.
During the recovery, two consecutive candles share an upper high. The first is bullish, the second bearish, matching highs marked by the dashed red line. Structurally this is a tweezer top. But notice what happens next: the next session is another bullish candle that closes above the tweezer top's high — no confirmation arrived. The pattern fails and the rally resumes. Real-world takeaway: tweezer tops in the middle of established uptrends often fail because there's no exhaustion behind them. The matching highs are a coincidence of two ordinary sessions, not evidence that buyers genuinely failed at a meaningful level. Tweezer patterns get much stronger when they form at prior resistance, at extended trend exhaustion, or with confluence from another technical factor.
After the failed tweezer, a brief decline forms. The first candle is a long bearish session continuing the decline. The next session is a doji that gaps below the first candle — and critically, the doji's shadows do not overlap with the first candle's shadows. The doji is isolated. The third session opens with an upside gap above the doji, with its shadows also not overlapping the doji's. The doji is "abandoned" — separated from the candles bracketing it by gaps on both sides. The next session continues higher — confirmation present. The reversal is decisive. Real-world takeaway: the strict non-overlap requirement is what makes this pattern rare. Many candles students try to label as abandoned babies have shadows that touch or overlap, which technically disqualifies them. True abandoned babies — where the gaps are clean on both sides — are uncommon enough that students may go months between sightings. The rarity is part of the pattern's reliability; when the structure is genuine, the signal carries weight.
Tweezers and abandoned babies sit at opposite ends of a quality spectrum. Tweezers are common but modest — they appear frequently, but their reliability is generally in the 50–60% range, meaning slightly more than a coin flip. Abandoned babies are rare but powerful — they appear seldom, but when they do, the structural rigor of the gaps gives them notably higher reliability than most patterns. The pedagogical pairing teaches an important principle: rarity often correlates with reliability in pattern analysis. Common patterns appear so often that random market noise produces many false instances. Rare patterns appear so seldom that random noise rarely manufactures them by chance. When a strict-structure pattern like the abandoned baby actually forms, the odds it represents real underlying market behavior are higher than for a loose-structure pattern like the tweezer. The interpretive habit being trained: respect the structural requirements. A tweezer with lows three ticks apart is a tweezer; one with lows separated by 2% of the range is not. An abandoned baby with clean gaps on both sides is an abandoned baby; one where shadows overlap on either side is a morning star or evening star — different pattern, different reliability. Students who learn to enforce the structural rules strictly get the reliability the pattern advertises. Students who relax the rules to find more patterns get worse outcomes from the same shapes.
Pattern statistics and sources
| Pattern | Confirmation | Volume | Reliability | Common Failure Mode |
|---|---|---|---|---|
| Tweezer bottom | Next candle closes above the second tweezer candle's body, ideally past its high. | Higher volume on the second tweezer candle than the first strengthens the signal — the failure to break the level happened with real participation. | Generally regarded as modest as a standalone signal; more useful as a confluence factor. | The level holds for two sessions then breaks on the third. |
| Tweezer top | Next candle closes below the second tweezer candle's body. | Higher volume on the second tweezer candle strengthens the signal. | Generally regarded as comparable to tweezer bottom in mirror — modest, requiring confluence. | Same as tweezer bottom — the level holds briefly then gives way. |
| Bullish abandoned baby | The third candle is itself the structural confirmation. Further follow-through on the next session strengthens the signal. | Heavy volume on the third candle; light volume on the doji is expected. | Generally regarded as among the strongest reversal signals when the strict gap structure is present. | Misidentification — the gaps aren't true gaps (shadows overlap), so what looks like an abandoned baby is actually a morning star. |
| Bearish abandoned baby | Same as bullish in mirror. | Heavy volume on the third candle. | Generally regarded as comparable in strength to bullish abandoned baby. | Same — misidentified as evening star when gaps aren't clean. |
Tweezer bottom: XS research describes the tweezer bottom as having a moderate success rate of around 50–60% when correctly signaling a reversal. Liberated Stock Trader's backtest reports a 55% win rate over 914 trades with very low expectancy (about 0.19), characterizing it as close to break-even in many contexts. Bulkowski's testing is notably skeptical, characterizing the tweezers bottom as a pattern where "price just continues lower" despite the support-area appearance, and ranking its 10-day post-breakout performance at 29th in bear markets with an average rise of 4.95%. Teaching point: Three sources converge on a similar conclusion — the pattern works modestly above chance but produces little tradeable edge without strong context. Bulkowski's harsh assessment is worth showing students because it counterbalances the more optimistic framings on trading-focused sites. Multi-source pool: thepatternsite.com, liberatedstocktrader.com, luxalgo.com, xs.com, litefinance.org, quantifiedstrategies.com. Tweezer top: LuxAlgo cites a success rate of about 56% for tweezer top patterns, emphasizing the importance of confirming with additional tools and broader market context. Multi-source pool: same as tweezer bottom. Bullish abandoned baby: Bulkowski's testing ranks the bullish abandoned baby 13th in effectiveness among 103 candlestick types, with a 70% success rate, while noting its rarity at frequency rank 92 with only 293 examples found across 4.7 million candle lines analyzed. QuantifiedStrategies reports it exhibits bullish turnaround approximately 70% of the time, with 71% price target accuracy in bear markets following downward breakouts. Multi-source pool: thepatternsite.com, quantifiedstrategies.com, walletfinder.ai, tradingsim.com, therobusttrader.com, patternswizard.com. Bearish abandoned baby: QuantifiedStrategies reports a 77% accuracy rate for the bearish abandoned baby pattern, though they note that in their S&P 500 backtest since 1993, the pattern produced a positive average return per trade of 0.23% — meaning the "bearish" pattern actually behaved bullishly in their data. PatternsWizard's research found that on average markets printed one abandoned baby pattern every 19,097 candles, with longest winning streak of 5 and longest losing streak of 11 trades for 2:1 risk-reward setups. Teaching point: The QuantifiedStrategies finding — that the bearish abandoned baby actually produced positive returns in their S&P 500 backtest — is exactly the kind of methodological surprise students need to see. A pattern named "bearish" doesn't necessarily produce bearish outcomes when tested rigorously. This is why students need to read the source itself and not rely on the pattern's name to predict its behavior. Multi-source pool: same as bullish abandoned baby.
Key Takeaways
- Tweezer bottom: matching lows after a sustained downtrend show sellers failed twice at the same floor — requires confirmation with a close above the second tweezer candle's body
- Tweezer tops fail frequently in established uptrends — matching highs are a coincidence without exhaustion; confluence with prior resistance or extended trend improves reliability
- Bullish abandoned baby: the doji must be isolated by true gaps on both sides with no shadow overlap — any shadow overlap converts the pattern to a morning star with lower reliability
- Rarity correlates with reliability: common patterns are frequently produced by random noise; rare strict-structure patterns are rarely manufactured by chance
- Enforce structural rules strictly — relaxing the rules to find more patterns produces worse outcomes from the same shapes
Quiz — 3 Questions
Answer one at a timeIn the chart, the tweezer top mid-rally fails because the next candle closes above the matching highs. What does this tell us about confirmation?