The Penetration Spectrum in Context — On-Neck Through Piercing
This chart is the most pedagogically important one in the series because it teaches a continuum, not isolated patterns. Students who understand penetration depth can read any two-candle pattern they encounter, named or unnamed.
- Read a single downtrend containing all four spectrum points — on-neck, in-neck, thrusting, and piercing — in sequence
- Identify the midpoint threshold on a prior bearish candle and determine which side of it the second candle closes on
- Explain why the same counter-trend shape produces continuation three times and reversal once
- Apply the single-ratio habit: measure the penetration rather than naming the pattern
The penetration spectrum — on-neck, in-neck, thrusting, piercing in context
The chart walks through a single downtrend that contains four two-candle patterns, each with progressively deeper penetration by the bullish second candle. Watch how the market resolves each one — the depth of penetration is the variable that determines outcome.
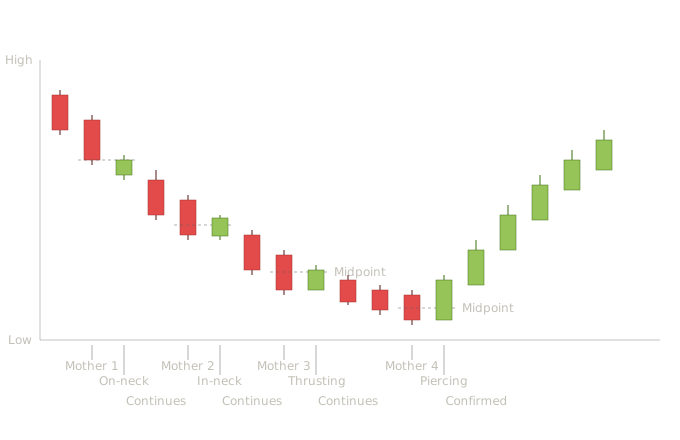
The penetration spectrum in context — on-neck, in-neck, thrusting, and piercing in a single downtrend showing how the midpoint threshold determines pattern meaning
Two bearish candles establish the decline. The second bearish candle (mother 1) is followed by a small bullish candle whose close lands at the prior candle's low — barely poking above it. The bullish session opened lower and rallied just enough to match the prior low, but couldn't push higher. The next session resumes the downtrend with another bearish candle. Real-world takeaway: the on-neck is the weakest possible counter-trend pressure. Buyers couldn't even get the close into the prior body. When buyers can't accomplish that minimum, the downtrend's structural integrity is intact.
The decline extends. After mother 2, a small bullish candle forms whose close lands slightly inside the prior bearish body — a shallow penetration, just above the prior low. Better than on-neck but still weak. The downtrend resumes with the next session. Real-world takeaway: in-neck shows buyers managed marginally more pressure than on-neck, but still couldn't break the prior body's lower portion. Continuation is still the high-probability outcome.
After mother 3, a bullish candle closes deeper into the prior body — but stops below the midpoint. The dashed midpoint line on the chart shows the threshold the second candle had to cross to become a reversal candidate. It didn't. The downtrend resumes. Real-world takeaway: the thrusting line is where students get tempted. The bullish candle's penetration looks meaningful, and students who haven't internalized the midpoint rule often treat thrusting lines as reversals. The classical reading is that any penetration below the midpoint still favors continuation, though the signal is weaker than on-neck or in-neck because the second candle came closer to mattering.
After mother 4, a bullish candle finally crosses above the midpoint of the prior body — the dashed line shows the threshold being broken. This is the structural shift. The next session continues higher — confirmation present. The reversal follows. Real-world takeaway: the same shape that was just continuation three times in a row becomes a reversal candidate only when the second candle closes above the midpoint. The threshold is a single price level, and crossing it changes the pattern's meaning entirely.
This chart teaches the most underrated concept in candlestick analysis: patterns are not discrete categories but points on a continuum. Students typically learn each pattern as a separate named entity with separate rules. The on-neck-through-piercing progression shows that they're actually four points on a single continuous spectrum, defined by one variable — how deeply the bullish second candle penetrates the prior bearish body. The interpretive habit being trained: measure the penetration. Don't ask "is this an on-neck or a thrusting line?" Ask "where did the second candle close relative to the prior body's midpoint?" Below the prior low → on-neck (weakest counter-pressure). At or just above the prior low → in-neck. Above the low but below the midpoint → thrusting. Above the midpoint → piercing (reversal candidate). Fully engulfing → bullish engulfing (strongest reversal signal). This frame compresses five named patterns into a single rule: the midpoint is the threshold. Below it, the trend continues. Above it, reversal becomes possible. Once a student sees the spectrum, they don't have to memorize five patterns — they have to measure one ratio.
Pattern statistics and sources
| Pattern | Confirmation | Volume | Reliability | Common Failure Mode |
|---|---|---|---|---|
| On-neck | Next candle continues in the original (bearish) direction. | Light volume on the small bullish candle is consistent with weak counter-trend pressure. | Generally regarded as the most reliable of the three continuation members of the spectrum. | The small bullish candle gains traction and the next session breaks higher. |
| In-neck | Next candle continues in the original direction. | Light volume on the small bullish candle. | Generally regarded as slightly less reliable than on-neck because the deeper penetration shows marginally more counter-trend pressure. | Same as on-neck. |
| Thrusting line | Next candle closes in the original direction. | Light volume confirms weak counter-trend pressure; heavy volume on the bullish candle is a warning that reversal is possible. | Generally regarded as the weakest of the three continuation members. The deeper penetration leaves the structural read more ambiguous. | The bullish candle's deeper penetration converts into a true reversal in the next session. |
| Piercing pattern | Next candle closes above the piercing candle's close. | Heavy volume on the second candle, especially during the recovery from the gap-down, strengthens the signal. | Generally regarded as a modest reversal signal — stronger than thrusting (different category) but weaker than full bullish engulfing. | Penetration depth too shallow, just barely above midpoint — sellers reassert. |
On-neck: Bulkowski's testing shows the on-neck functions as a bearish continuation 56% of the time, which he characterizes as near-random. Angel One's analysis describes the on-neck as showing the best confirmation among the three continuation members (on-neck, in-neck, thrusting). Multi-source pool: thepatternsite.com, angelone.in, chart-formations.com, quantifiedstrategies.com. In-neck: AnalyzingAlpha's 21-year backtest reports that in-neck as a bearish continuation pattern generally "loses money or barely breaks even" under standard rules. Teaching point: The in-neck illustrates that pattern reliability and pattern profitability are different things. A pattern can "work" in the directional sense (price continues) while still failing to produce trading profits after costs. Multi-source pool: thepatternsite.com, angelone.in, analyzingalpha.com, chart-formations.com. Thrusting line: Source aggregation describes the thrusting pattern as a reliable continuation sign in established downtrends when volume expansion accompanies the confirmation candle. LiteFinance characterizes the thrusting pattern as a reliable indicator in robust trends with accuracy depending on market situation, trading volumes, and key levels. Multi-source pool: thepatternsite.com, litefinance.org, chart-formations.com, strike.money. Piercing pattern: Source aggregation cites a ~64–80% success rate range for the piercing line across various methodologies (with methodology variation noted as significant). Teaching point: That 64–80% range across sources is wider than for most patterns, which itself tells students something: methodological choices substantially affect how the piercing pattern is measured. Students looking at any single source's piercing-pattern statistics should ask what specifically that source defined as success. Multi-source pool: thepatternsite.com, strike.money, litefinance.org, chart-formations.com, ATAS research aggregation.
Key Takeaways
- Four patterns, one variable: how deeply the second candle closes into the prior body determines whether the pattern is continuation or reversal
- On-neck → in-neck → thrusting: all three keep the downtrend alive; the difference is how much counter-pressure buyers generated
- Piercing: the single threshold crossing — above the prior body's midpoint — converts the pattern from continuation to reversal candidate
- The midpoint measurement replaces five pattern names with one ratio; measure the penetration rather than naming the shape
Quiz — 3 Questions
Answer one at a timeIn the chart, three consecutive counter-trend candles (on-neck, in-neck, thrusting) all fail to produce a reversal. What changes with the fourth counter-trend candle?