ADX and Parabolic SAR
ADX measures trend strength without indicating direction — making it the most important regime filter in technical analysis. Parabolic SAR provides adaptive trailing stop levels that accelerate as trends extend. Both tools were developed by J. Welles Wilder Jr. and designed to work together.
- Explain what ADX measures and why it doesn't indicate trend direction
- Identify the four ADX strength thresholds and explain what each signals about appropriate trading strategy
- Describe the role of +DI and -DI in the DMI system and when their crossovers are meaningful
- Explain how Parabolic SAR's acceleration factor creates dots that trail price and generate stops
- Apply ADX as a regime filter to determine when to use trend-following versus mean-reversion strategies
- Recognize why Parabolic SAR performs poorly in ranging markets and how ADX solves this problem
Two Tools From the Same Developer
The Average Directional Index (ADX) and Parabolic SAR (Stop and Reverse) are two trend-focused tools that serve specific purposes within technical analysis. ADX measures the strength of a trend without indicating its direction — it tells you how strong any trend is, whether bullish or bearish, but not which way the trend is going. Parabolic SAR provides specific dynamic stop-loss levels and signals trend changes through its position relative to price.
Both tools were developed by J. Welles Wilder Jr. (the same developer who created RSI from Lesson 34) and published in his 1978 book 'New Concepts in Technical Trading Systems.' That book introduced four major indicators that became standard equipment in technical analysis: RSI, ADX, Parabolic SAR, and ATR (Average True Range). Wilder's contributions to technical analysis are remarkable for both their durability and their specific design philosophy — each indicator answers a precisely defined question and was designed to work alongside the others rather than replace them.
This lesson covers what ADX and Parabolic SAR are, how they're calculated, how to read them in different contexts, and how they integrate with the broader analytical framework.
Vocabulary
| Term | Definition |
|---|---|
| Average Directional Index (ADX) | A trend-strength indicator that measures the strength of a trend on a scale of 0 to 100, regardless of direction. ADX rising means trend strength is increasing; ADX falling means trend strength is decreasing. The indicator does not indicate trend direction — that comes from companion indicators or other analysis. |
| +DI (Positive Directional Indicator) | One of two directional lines that accompany ADX in most implementations. Measures upward directional movement. Higher +DI values indicate stronger bullish directional movement. |
| -DI (Negative Directional Indicator) | The bearish counterpart to +DI. Measures downward directional movement. Higher -DI values indicate stronger bearish directional movement. |
| DMI (Directional Movement Index) | The complete system that includes ADX, +DI, and -DI together. Sometimes the term DMI refers to just the +DI/-DI pair, with ADX as a separate calculation derived from them. |
| ADX 25 threshold | A commonly used reference level. ADX above 25 typically indicates a trend strong enough that trend-following strategies are appropriate. ADX below 25 typically indicates either no trend or a weak trend where mean-reversion strategies may work better. |
| ADX 40 threshold | Another common reference. ADX above 40 indicates a very strong trend. Some traders interpret high ADX as signaling potential trend exhaustion (extreme readings precede reversals), while others interpret it as confirming continued trend strength. |
| Parabolic SAR (Stop and Reverse) | A trend-following indicator that displays dots above or below price bars. When dots are below price, the trend is interpreted as bullish; when dots are above price, bearish. The dots can serve as dynamic stop-loss levels — exit longs when price falls to the dot below, exit shorts when price rises to the dot above. |
| Acceleration factor | A parameter in Parabolic SAR that determines how quickly the dots accelerate toward price as a trend extends. Higher acceleration factors produce dots that move toward price faster, generating earlier exits but more false signals. The default is 0.02, with most platforms allowing customization. |
| Maximum acceleration | The upper limit on the acceleration factor. Default is 0.20 in Wilder's original specification. Limits how quickly the dots can move toward price even as the trend extends. |
| SAR reversal | When the Parabolic SAR dots switch from above price to below price (or vice versa). The reversal indicates the indicator has changed its trend assessment. Some traders use SAR reversals as direct entry signals; others use them as confirmation. |
| Trend regime filter | Using ADX or similar tools to determine whether the market is currently trending or ranging, then selecting trading strategies appropriate for the identified regime. ADX is the most common trend regime filter in technical analysis. |
What the Configuration Settings Actually Mean
- ADX settings. The lookback period (default 14) determines how much history is included in the calculation. Shorter periods produce more responsive ADX that responds faster to changes in trend strength; longer periods produce smoother ADX. The 14-period default works for most applications. Some implementations also allow customization of the smoothing applied to the DI lines.
- Parabolic SAR settings. Starting acceleration factor (default 0.02) and maximum acceleration factor (default 0.20). Increasing the starting factor makes the indicator more sensitive but more prone to whipsaws. Decreasing it makes the indicator slower but more reliable. Most traders use Wilder's original defaults.
The Math Behind ADX
ADX's calculation is more complex than most indicators because it involves several intermediate steps.
Step 1: Calculate True Range (TR) for each bar. TR is the maximum of (high - low), (high - prior close), and (low - prior close). It measures the total price movement during the bar including any gaps from the prior close.
Step 2: Calculate +DM (positive directional movement) and -DM (negative directional movement). +DM equals (current high - prior high) if that's positive and greater than (prior low - current low); otherwise 0. -DM equals (prior low - current low) if that's positive and greater than (current high - prior high); otherwise 0. This calculation captures whether the current bar made meaningful new highs or lows compared to the prior bar.
Step 3: Smooth TR, +DM, and -DM using Wilder's smoothing (similar to EMA with a specific smoothing constant) over the lookback period.
Step 4: Calculate +DI and -DI:
Positive Directional Indicator
+DI = (Smoothed +DM / Smoothed TR) × 100
Negative Directional Indicator
−DI = (Smoothed −DM / Smoothed TR) × 100
Step 5: Calculate DX (Directional Index):
Directional Index
DX = (|+DI − −DI| / (+DI + −DI)) × 100
DX measures the strength of directional movement regardless of direction. When +DI and -DI are very different, DX is high (strong directional movement). When they're similar, DX is low (weak directional movement).
Step 6: Smooth DX to produce ADX:
Average Directional Index
ADX = Smoothed DX over the lookback period
The final smoothing creates the stable ADX line that traders read.
ADX measures how much directional movement has been happening, regardless of which direction. Whether price has been strongly trending up or strongly trending down, ADX rises. Whether price has been oscillating without direction or moving slowly, ADX falls. This direction-agnostic property makes ADX useful as a regime filter — it tells you whether to use trend-following strategies (when ADX is high) or mean-reversion strategies (when ADX is low).
The Math Behind Parabolic SAR
Parabolic SAR's calculation is recursive — each new value depends on prior values and the current trend direction.
Mathematical procedure during an uptrend:
Parabolic SAR
SAR today = SAR yesterday + AF × (EP − SAR yesterday)
Where AF is the acceleration factor and EP is the extreme point (the highest high since the trend began). The acceleration factor starts at 0.02 and increases by 0.02 each time price makes a new extreme point, up to the maximum of 0.20. As the trend extends, AF rises and the SAR dots move toward price faster.
During a downtrend, the formula is similar but using the lowest low as EP and SAR positioned above price.
Trend reversal occurs when price crosses through the SAR. The indicator then flips to the other side of price, AF resets to 0.02, and the calculation begins again in the opposite direction.
SAR creates a dynamic trailing stop that adjusts as trends extend. Early in trends, the dots are relatively far from price (giving the trend room to develop). As trends extend, the dots accelerate toward price (locking in profits and forcing exits if the trend reverses). This adaptive behavior makes SAR particularly useful as a stop-loss tool rather than as an entry signal.
Reading ADX in Context
ADX trend strength interpretation:
- ADX below 20: Very weak or no trend. Mean reversion strategies typically work better than trend-following.
- ADX between 20-25: Borderline. Trend strength is developing but not yet confirmed.
- ADX between 25-40: Strong trend in progress. Trend-following strategies are appropriate.
- ADX above 40: Very strong trend. Continuation is likely but watch for exhaustion signals.
- ADX above 50: Extreme trend strength. Often associated with parabolic moves that eventually exhaust.
Rising ADX (regardless of level) means trend strength is increasing. Falling ADX means trend strength is decreasing. ADX falling from a high level often signals trend exhaustion before price reflects it.
ADX tells you trend strength; +DI versus -DI tells you direction. When +DI is above -DI, the trend is bullish. When -DI is above +DI, bearish. Crossovers between +DI and -DI mark potential trend changes.
The most common use of ADX in integrated analysis is determining whether trend-following or mean-reversion strategies apply. When ADX is above 25, momentum oscillator signals (RSI crossovers, MACD signals) tend to work better. When ADX is below 25, mean-reversion signals (overbought/oversold in ranging markets, mean reversion to moving averages) tend to work better.
Reading Parabolic SAR in Context
- SAR as trailing stop. The most common use. In an uptrend, set stops at the SAR level below price. As price advances, the SAR accelerates upward, automatically trailing the stop. When price eventually falls to the SAR, the stop triggers — capturing most of the trend's profits while exiting before deeper retracements.
- SAR as trend confirmation. The position of SAR (below price = bullish trend, above price = bearish trend) confirms what other analysis suggests. A bullish chart pattern with SAR below price and ADX rising above 25 provides multiple-layer confirmation.
- SAR reversals as trade signals. Some traders use SAR reversals (dots flipping from above to below price or vice versa) as direct entry triggers. This use case has mixed historical reliability — SAR reversals occur frequently and many produce whipsaws. Best used as confirmation within broader analysis.
- SAR in ranging markets. Parabolic SAR works poorly in ranging markets because the dots reverse frequently as price oscillates within the range, producing repeated false signals. ADX confirmation that the market is trending (ADX > 25) substantially improves SAR's reliability.
Pattern Statistics and Sources
QuantifiedStrategies' research on ADX concludes that the indicator is somewhat useful on its own but adds great value when used alongside other indicators in trading strategies. The research notes ADX's design as a complementary indicator within Wilder's broader system rather than as a standalone signal generator.
Research on Parabolic SAR backtesting found that simple standalone Parabolic SAR rules do not produce reliably profitable strategies across assets, even after tweaking settings. The indicator's value comes primarily through combination with trend filters or other indicators, particularly ADX which filters out the choppy market conditions where Parabolic SAR produces excessive false signals.
The pattern is consistent with every other indicator we've covered. Standalone ADX or Parabolic SAR signals don't produce strong results. The two tools together — ADX confirming trend strength and Parabolic SAR providing entry timing and trailing stops — work better than either alone. Both work substantially better when integrated with broader analysis.
- J. Welles Wilder Jr.'s 'New Concepts in Technical Trading Systems' (1978) — original specifications for both indicators
- quantifiedstrategies.com — backtested ADX and SAR strategies
- stockcharts.com ChartSchool — detailed reading guides
- AvaTrade and Capital.com educational materials — practical application examples
- Academic literature via Google Scholar — search 'ADX directional movement,' 'Parabolic SAR backtest'
Common Student Mistakes with ADX and Parabolic SAR
- Using ADX for direction instead of strength. ADX doesn't indicate direction. Beginners sometimes interpret a rising ADX during a downtrend as bullish (because ADX itself is rising) without recognizing that ADX rises with any strong trend regardless of direction.
- Trading +DI/-DI crossovers without ADX confirmation. The DI crossovers occur frequently, including during ranging markets where they produce whipsaws. ADX above 25 should be required before treating DI crossovers as actionable signals.
- Using Parabolic SAR in ranging markets. SAR produces repeated whipsaws when price oscillates within a range. The dots flip back and forth as price crosses through them in both directions, generating false signals. ADX confirmation (above 25) substantially reduces this problem.
- Treating SAR reversals as standalone entry signals. SAR reversals work better as confirmation than as primary triggers. Better entry signals come from price action analysis with SAR providing trailing stop levels and trend confirmation.
- Setting acceleration factor too aggressively. Increasing the SAR acceleration factor from the default 0.02 produces more sensitive signals but more whipsaws. Most traders should stick with the default unless they have specific backtested reason to change.
- Ignoring the integration between ADX and SAR. The two tools were designed to work together. Using SAR without ADX context, or ADX without SAR for entry timing, misses the combined value Wilder designed.
Reading ADX and Parabolic SAR Integrated with Prior Lessons
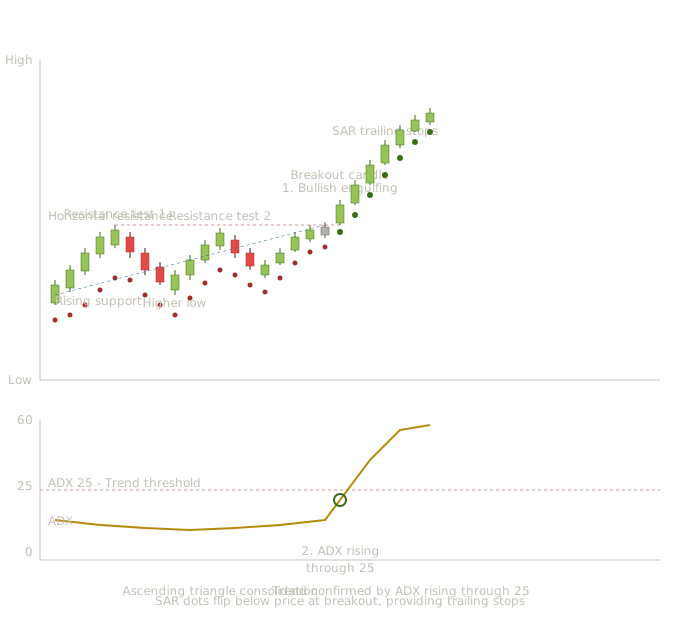
Ascending triangle (Lesson 19) with bullish engulfing at the breakout (Lesson 5), ADX rising through 25 confirming trend strength, and Parabolic SAR flipping from above to below price — demonstrating ADX as regime filter and SAR as trailing stop within integrated analysis
This chart shows what the integrated reading looks like with ADX and Parabolic SAR added. The chart includes an ascending triangle from Lesson 19, a bullish engulfing candle pattern at the breakout from Lesson 5, ADX showing trend strength transition, and Parabolic SAR dots flipping from above to below price at the breakout.
The ascending triangle development (candles 1-18). Price oscillates within the ascending triangle structure. Notice ADX stays below the 25 threshold throughout the consolidation — confirming that the market is currently in a ranging regime where trend-following signals shouldn't be trusted heavily. The Parabolic SAR dots remain above price during the consolidation, reflecting the lack of clear directional trend.
During the consolidation, traders watching only the chart pattern might be tempted to anticipate the eventual breakout direction and take early positions. ADX below 25 says wait — the trend isn't strong enough to justify directional positions yet.
The doji at the apex (candle 18). A doji forms near the triangle's apex, showing pure indecision at the structural moment. From Lesson 2, this is the indecision candle that often precedes directional resolution. ADX is still below 25 but starting to flatten — the consolidation phase is reaching its natural end.
A powerful bullish candle drives price decisively above the triangle's horizontal resistance. From Lesson 5, this is the bullish engulfing pattern. From Lesson 19, this is the triangle's structural breakout.
The Parabolic SAR dot flips from above price (where it had been throughout the consolidation) to below price at this candle. The SAR has confirmed the trend change. The dot below price now becomes the trailing stop reference for the new long position.
As the breakout develops, ADX begins rising rapidly through the 25 threshold. This confirms that the breakout represents real trend strength, not just a temporary spike. The combination of the chart pattern breakout, the bullish engulfing candle, the SAR reversal, and the ADX crossing 25 creates multi-dimensional confirmation that the directional move is genuine.
The post-breakout trend (candles 20-26). Seven bullish candles drive price progressively higher. ADX continues climbing, eventually approaching 50 — signaling very strong trend strength. The Parabolic SAR dots accelerate upward as the trend extends, providing a trailing stop that follows the rally.
What this integrated chart teaches together
Several pedagogical points emerge.
ADX as regime filter prevents premature trades. During the ascending triangle's consolidation, ADX below 25 warned that trend-following strategies weren't yet appropriate. A trader who waited for ADX confirmation avoided trying to anticipate the breakout direction during the consolidation.
The combination of multiple signals at the breakout creates high-conviction entry. Chart pattern breakout, candle reversal pattern, SAR direction change, and ADX rising through 25 all align at the same moment. Multi-dimensional confluence justifies meaningful position sizing.
Parabolic SAR provides systematic trailing stops. Rather than guessing where to place stops during the rally, the SAR dots provide objective trailing stop levels that adjust automatically as the trend extends. The trader can hold the position with confidence that the systematic stop will exit if the trend reverses.
ADX direction matters as much as level. ADX rising through 25 is more meaningful than ADX simply being above 25. The rising direction signals strengthening trend; static ADX (even above 25) signals a trend that may be losing momentum.
Integration with Prior Lessons
ADX and Parabolic SAR integrate with everything the curriculum has built. ADX as regime filter determines whether the trend-following signals from moving averages and MACD apply (trending markets) or whether mean-reversion approaches apply (ranging markets). Parabolic SAR provides trailing stops that integrate with the entry signals from chart patterns and candle reversals. The combination of regime identification (ADX) and dynamic stops (SAR) provides specific structure that improves the execution of strategies built around any of the other tools.
How This Lesson Connects to What Comes Next
Lesson 39 begins the Fibonacci coverage with retracements. Fibonacci tools represent a different analytical tradition than the indicators we've covered so far — they're drawing tools rather than calculated studies, based on mathematical ratios rather than smoothed price data. The Fibonacci coverage gets two lessons (39 for retracements, 40 for extensions and projections) because of the depth and breadth of Fibonacci applications in working trading.
Key Takeaways
- ADX measures trend strength (0-100) but NOT direction — a reading of 40 during a strong downtrend and a reading of 40 during a strong uptrend are identical; +DI vs -DI determines direction
- ADX below 20: no/weak trend; 20-25: borderline; 25-40: strong trend, trend-following appropriate; above 40: very strong trend, watch for exhaustion
- ADX is the most useful regime filter in technical analysis — it determines whether to apply trend-following signals (ADX above 25) or mean-reversion signals (ADX below 25)
- Parabolic SAR dots accelerate toward price as trends extend (AF starts at 0.02, increases by 0.02 each time a new extreme point is set, up to 0.20 max) — this creates a trailing stop that tightens automatically
- SAR performs poorly in ranging markets, producing repeated whipsaws — ADX confirmation above 25 is the solution to this problem
- Wilder designed ADX and SAR to work together: ADX confirms the trend is strong enough for SAR to work, SAR provides the specific entry and stop levels
Quiz — 3 Questions
Answer one at a timeA stock's ADX reads 35 and has been rising for two weeks. The -DI is above the +DI. What does this combination tell the trader about market conditions and appropriate strategy?
In this lesson
400 — Technical Indicators — Integration and Methodology