Fibonacci Extensions and Projections
Extensions project where price might go beyond the original swing's endpoint. Where retracements identify where pullbacks might find support, extensions identify profit targets and potential exhaustion levels. The 161.8% extension is the most commonly used profit target in Fibonacci-based trading.
- Explain the conceptual difference between Fibonacci retracements and extensions
- Calculate two-point and three-point Fibonacci extension targets given swing measurements
- Identify the 127.2%, 161.8%, 200%, and 261.8% extension levels and what each represents
- Apply extension levels as profit targets in conjunction with chart pattern measured moves
- Recognize the 261.8% exhaustion pattern and explain why parabolic moves often reverse there
- Identify target confluence when extensions from different swings align at the same price
Beyond the Original Swing — Projecting Targets
Fibonacci extensions and projections extend the Fibonacci concept beyond the original swing's boundaries. Where retracements identify where pullbacks within a trend might find support or resistance, extensions identify where the trend might continue beyond the original move's endpoint. The same Fibonacci ratios that produce retracement levels also produce extension levels, but applied to project price targets rather than identify pullback zones.
This lesson covers what Fibonacci extensions are, how they differ from projections (the terms are sometimes used interchangeably but have specific technical distinctions), the standard extension levels and what they represent, common mistakes that mislead traders who use them mechanically, and how to integrate them with broader analysis.
Vocabulary
| Term | Definition |
|---|---|
| Fibonacci extension | A drawing tool that projects price targets beyond a measured swing's endpoint using Fibonacci ratios. The most common extensions are 127.2%, 161.8%, 200%, 261.8%, and 423.6% of the original swing's range. |
| Fibonacci projection | Similar to extension but technically distinct. A projection uses three anchor points (typically the swing's start, end, and the start of a subsequent pullback) to project price targets that account for both the original move and the retracement. The terminology varies across platforms and traders, but the underlying mathematics is similar. |
| 127.2% extension | The square root of 1.618 (rounded). Represents modest extension beyond the original move's endpoint. Often acts as the first target for trend continuation after a healthy retracement. |
| 161.8% extension | The full golden ratio. The most important Fibonacci extension level. Represents substantial extension beyond the original move. Often acts as a major target for measured-move calculations. |
| 200% extension | Mathematically not a Fibonacci ratio (it's just doubling), but commonly included because of its psychological significance. |
| 261.8% extension | The golden ratio multiplied by 1.618 (1.618 × 1.618 = 2.618). Represents very substantial extension. Often marks the boundary where parabolic moves typically exhaust. |
| 423.6% extension | Even further extension, calculated from higher-order Fibonacci relationships. Rarely reached in normal market moves but can appear in highly volatile assets during powerful trends. |
| Measured-move target | A target calculated by projecting the original move's range from the post-retracement starting point. Fibonacci extensions provide formalized measured-move calculations using specific ratios. |
| Three-point projection | A Fibonacci projection that uses three anchor points: swing low, swing high (or vice versa), and pullback low (or high). The pattern matches "1-2-3" wave structures used in Elliott Wave analysis. |
| Target confluence | When multiple Fibonacci extension levels from different drawings align at approximately the same price, creating a stronger target reference. Similar to confluence with retracements but applied to projected targets. |
| Exhaustion at extension levels | The tendency for trends to exhaust or reverse at major Fibonacci extension levels, particularly 161.8% and 261.8%. Not guaranteed but observed frequently enough to be a useful reference for taking profits. |
| Time projections | A variant of Fibonacci projection that applies the same ratios to time rather than price. Predicts when future price events might occur based on the time of past price events. Less widely used than price-based Fibonacci tools. |
What the Configuration Settings Actually Mean
- Anchor points. Fibonacci extension requires either two anchor points (similar to retracement) or three anchor points (for the projection variant). The three-point method anchors the swing's start, end, and pullback point, which produces more specific targets than the two-point method.
- Visible levels. Standard extensions are 127.2%, 161.8%, and 200%. Some implementations also show 261.8% and 423.6%. The choice of displayed levels depends on the trader's preference and the chart's structure.
- Direction. The direction of the original swing determines whether extensions project upward (for bullish swings) or downward (for bearish swings). Most platforms handle this automatically based on the anchor points.
The Math Behind Fibonacci Extensions
The extension ratios come from the same mathematical relationships as the retracement ratios but applied differently.
127.2% extension. The square root of 1.618 equals 1.272 (rounded). For a swing from $50 to $100 (a $50 move), the 127.2% extension would be at $100 + ($50 × 0.272) = $113.60.
Actually, this calculation method depends on how the extension tool is configured. Let me work through both common implementations.
Method 1: Two-point extension from swing endpoint. The extension is calculated from the swing's endpoint, with the ratios applied to the swing's range. For a $50 to $100 move:
127.2% extension: $100 + ($50 × 0.272) = $113.60 161.8% extension: $100 + ($50 × 0.618) = $130.90 200% extension: $100 + ($50 × 1.000) = $150.00 261.8% extension: $100 + ($50 × 1.618) = $180.90
Method 2: Three-point projection from pullback. Using a pullback low after the initial swing as the third anchor. If the initial move was $50 to $100 and price retraced to $80 before resuming:
127.2% projection: $80 + ($50 × 1.272) = $143.60 161.8% projection: $80 + ($50 × 1.618) = $160.90 261.8% projection: $80 + ($50 × 2.618) = $210.90
The three-point projection produces targets that account for both the original move's size and the retracement depth, which generally produces more relevant targets than two-point extensions.
Extensions project future price levels by applying Fibonacci-derived ratios to past price ranges. The mathematical reasoning is that markets often respect proportional relationships — if a move covered $50, future continuations of that move often cover $50 × specific ratio. Whether this works because of mathematical truth or because so many traders watch these levels, the levels do appear to function as structural targets often enough to be useful references.
Reading Fibonacci Extensions in Context
- Setting profit targets. The most common use of Fibonacci extensions. Traders identify the original swing, draw extensions, and set profit targets at the 127.2%, 161.8%, or 261.8% level depending on conviction and trend strength. The 161.8% level is the most commonly used profit target.
- Identifying parabolic exhaustion. Strong trends that reach 261.8% extensions often exhaust shortly afterward. This isn't guaranteed but happens frequently enough that 261.8% serves as a useful warning level — when price reaches this extension, watch for reversal signals carefully.
- Confluence with measured moves. Chart patterns from earlier lessons (head and shoulders, double tops, triangles) all have measured-move targets calculated from pattern geometry. When these chart-pattern measured moves align with Fibonacci extensions, the target confluence carries substantial weight.
- Multi-swing extension confluence. Drawing extensions on multiple swings and finding where the extension levels overlap identifies high-probability target zones. A 161.8% extension from one swing aligning with a 127.2% extension from another swing creates a confluence target.
Pattern Statistics and Sources
Like Fibonacci retracements, the research on extensions is methodologically challenging because of the subjectivity in swing identification. The general findings: extensions show statistically significant tendency to act as reversal levels, with the 161.8% level showing the strongest reliability. The 261.8% level marks frequent exhaustion points in parabolic moves. Confluence between extensions from different swings substantially increases reliability.
- Same sources as Fibonacci retracements — the literature treats the tools together
- Particular references: Robert Fischer's books on Fibonacci specifically cover extension applications in depth.
Common Student Mistakes with Fibonacci Extensions
- Treating extensions as guaranteed targets. Like all technical tools, extensions are probabilistic references, not guaranteed price destinations. Price may reach the extension, fall short, or exceed it. The extension provides a planning reference, not a certainty.
- Using extensions without retracement analysis. Extensions work best when applied to moves that have completed their retracement structure. Extending a move that's still in its initial directional phase, before any retracement, produces less reliable targets than extending after the retracement-and-resumption pattern has developed.
- Choosing wrong anchor points. As with retracements, anchor selection matters enormously. Different anchors produce different extension levels. The choice of anchors requires understanding what move you're trying to project.
- Ignoring the 261.8% exhaustion pattern. Many traders set targets at 161.8% and don't watch the 261.8% level. But when price reaches 261.8% (often during powerful directional moves), reversal probability increases substantially. Traders still in positions at 261.8% should manage risk aggressively.
- Confusing extensions with measured moves from chart patterns. The two are related but not identical. Chart pattern measured moves use pattern geometry; Fibonacci extensions use Fibonacci ratios. They sometimes coincide (creating useful confluence) but often produce different targets. Understanding which method you're using matters.
Integration with Prior Lessons
Fibonacci extensions integrate with chart pattern measured moves to create dual-confirmation target zones. A head and shoulders pattern's measured move calculated from pattern height, aligning with a 161.8% Fibonacci extension from the prior swing, produces a target zone that has both chart pattern logic and Fibonacci logic supporting it. Multi-source target zones like this are among the most reliable price projections available in technical analysis.
Reading Fibonacci Extensions Integrated with Prior Lessons
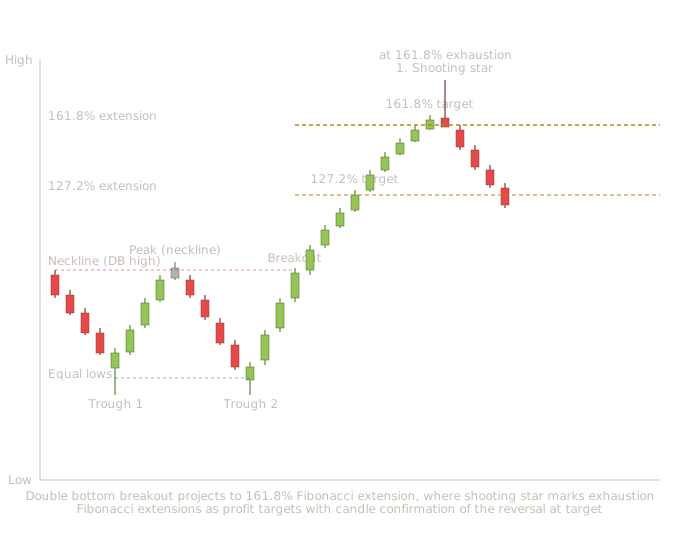
Double bottom pattern (Lesson 17) with shooting star at the 161.8% Fibonacci extension (Lesson 3) — progressive integration of candle patterns, chart patterns, and Fibonacci extension targets
This chart shows what the integrated reading looks like with Fibonacci extensions added. The chart includes a double bottom from Lesson 17, a shooting star from Lesson 3, and Fibonacci extension levels projected as price targets after the chart pattern breakout.
The double bottom development (candles 1-13). Price forms a double bottom pattern with two troughs at approximately equal lows and an intervening peak that defines the neckline.
The breakout above the neckline (candles 14-16). Price drives decisively above the neckline resistance. The double bottom has now completed structurally.
Drawing Fibonacci extensions. The extensions are projected from the swing's structural points — using the cup-style breakout method, extensions project from the neckline level (the structural pivot) based on the pattern's height. The 127.2% extension marks the first major target; the 161.8% extension marks the more significant target where strong moves often exhaust.
The trend continuation toward targets (candles 17-25). Nine bullish candles drive price progressively higher toward the extension levels. Price reaches and slightly exceeds the 127.2% extension, then continues toward the 161.8% level.
A shooting star forms at exactly the 161.8% Fibonacci extension level. From Lesson 3, the shooting star is the canonical bearish reversal candle. At the 161.8% extension level, this candle pattern carries amplified significance — extreme momentum has reached the major Fibonacci target where exhaustion frequently occurs.
The reversal toward the neckline (candles 27-31). Five bearish candles drive price down from the 161.8% extension level. The exhaustion signal at the major Fibonacci extension was validated by sustained directional reversal.
Fibonacci extensions provide objective profit targets. Rather than guessing where to take profits during a trending move, the extensions provide specific reference levels backed by mathematical reasoning. The 127.2% level represents the initial target; the 161.8% level represents the major target where many trends exhaust. Confluence between candle reversal and Fibonacci target creates high-quality exit signals. The shooting star alone would be a moderate-conviction reversal signal. The shooting star at the 161.8% Fibonacci extension is a high-conviction exit signal because two analytical layers agree. Chart pattern measured moves often align with Fibonacci extensions. The double bottom's measured-move target (projecting the pattern's height upward from the neckline) often falls near Fibonacci extension levels, creating confluence between two different analytical methodologies.
How This Lesson Connects to What Comes Next
Lesson 41 covers multi-indicator confluence — bringing together everything the technical analysis section has covered into a coherent multi-dimensional analysis framework. Lesson 42 covers building a personalized methodology that integrates the entire curriculum from Lesson 1 forward into an approach readers can apply systematically to their own trading. These final two lessons synthesize rather than introduce new material, completing the curriculum's progression from individual tools to integrated methodology.
Key Takeaways
- Extensions project price targets beyond a swing's endpoint; the most common are 127.2%, 161.8%, 200%, and 261.8% of the original swing's range
- 127.2% = square root of 1.618; 161.8% = full golden ratio; 261.8% = golden ratio squared (1.618 × 1.618)
- Three-point projections (using swing start, swing end, and pullback low as anchors) produce more structurally relevant targets than two-point extensions because they account for where the retracement ended
- The 161.8% extension is the most commonly used profit target in Fibonacci-based trading; the 261.8% extension is a frequent exhaustion level for parabolic moves
- Confluence between a Fibonacci extension and a chart pattern measured move creates a dual-confirmation target zone substantially more reliable than either reference alone
- Extensions are probabilistic targets, not guaranteed destinations — price may fall short of, reach, or exceed any extension level
Quiz — 3 Questions
Answer one at a timeA stock moves from $40 to $70 (a $30 move), then pulls back to $55. A trader uses the three-point projection method with these three anchors. What is the 161.8% projection target?
In this lesson
400 — Technical Indicators — Integration and Methodology