Relative Strength Index (RSI)
RSI measures how fast price is changing, not where price has been. This fundamental distinction from moving averages and Bollinger Bands makes RSI the most widely used momentum oscillator — and the specific divergence patterns it reveals are among the most reliable signals in technical analysis.
- Explain what RSI measures and how it differs conceptually from moving averages and Bollinger Bands
- Calculate RS and RSI given average gain and average loss values
- Distinguish overbought/oversold signals in trending markets from the same signals in ranging markets
- Identify bullish and bearish divergence on RSI and explain why divergence precedes price reversals
- Explain hidden divergence and how it signals trend continuation rather than reversal
- Integrate RSI divergence readings with head and shoulders chart patterns and named candle patterns
What RSI Measures and Why It Matters
The Relative Strength Index, almost always called RSI, is the most widely used momentum oscillator in technical analysis. Developed by J. Welles Wilder Jr. and published in his 1978 book 'New Concepts in Technical Trading Systems,' RSI has remained popular for nearly five decades because it answers a specific question that traders genuinely need answered: how fast is price changing, and is the speed sustainable?
This question is fundamentally different from what moving averages and Bollinger Bands answer. Moving averages tell you where price has been on average. Bollinger Bands tell you whether price is at a statistical extreme. Neither tells you anything about the speed of price change. A market can be in a strong uptrend with price well above its moving average and approaching the upper Bollinger Band, but the momentum behind the trend might be fading even as price continues higher. RSI is designed to detect this kind of divergence between price action and underlying momentum.
The conceptual insight that makes RSI useful: sustainable trends require sustained momentum. When a trend's momentum starts fading even as price continues moving in the trend's direction, the trend is showing signs of exhaustion before the price itself reveals the exhaustion. RSI can show this exhaustion several bars or even weeks before the price reversal that confirms it.
This lesson covers what RSI is, how it's calculated, how to read it in different market conditions, the specific divergence patterns that make it valuable, common mistakes that destroy traders who use it mechanically, and how to integrate it with everything the curriculum has already built.
Vocabulary
| Term | Definition |
|---|---|
| Relative Strength Index (RSI) | A momentum oscillator that measures the speed and magnitude of price changes over a specified period. RSI values range from 0 to 100, with values above 50 indicating that recent price changes have been net positive and values below 50 indicating net negative. Developed by J. Welles Wilder Jr. in 1978. |
| Oscillator | A general category of indicator that fluctuates within a bounded range (typically 0 to 100, or -100 to +100, depending on the specific oscillator). Oscillators are designed to identify when price action has reached extremes relative to recent history, which can signal potential reversals or continuations depending on context. |
| Overbought | A reading where RSI has risen high enough (traditionally above 70) that price may have moved too far too fast and could be due for a pullback. Critically, overbought does not automatically mean a sell signal — in strong uptrends, RSI can remain overbought for extended periods while the trend continues. |
| Oversold | The inverse. A reading where RSI has fallen low enough (traditionally below 30) that price may have moved too far too fast on the downside and could be due for a bounce. In strong downtrends, RSI can remain oversold for extended periods while the trend continues. |
| Centerline (50 level) | The midpoint of the RSI scale. Crossings above 50 indicate net upward momentum; crossings below 50 indicate net downward momentum. Some traders use 50-level crossings as confirmation signals for trend changes identified through other analysis. |
| RSI period | The number of bars used in the RSI calculation. Wilder's original specification used 14 periods, which remains the default in most platforms and most trading literature. Shorter periods (9, 5) produce more sensitive RSI that responds faster but generates more false signals; longer periods (21, 28) produce smoother RSI with fewer signals. |
| Bullish divergence | When price makes a lower low but RSI makes a higher low. The price action suggests continued bearish momentum, but RSI is signaling that the bearish momentum is actually fading. Often precedes meaningful reversals because RSI is detecting weakness in the downtrend before price reflects it. |
| Bearish divergence | The inverse. When price makes a higher high but RSI makes a lower high. The price action suggests continued bullish momentum, but RSI is signaling that the bullish momentum is fading. Often precedes meaningful reversals because RSI is detecting weakness in the uptrend before price reflects it. |
| Hidden bullish divergence | When price makes a higher low but RSI makes a lower low. Counterintuitively, this is a trend continuation signal rather than a reversal signal. It indicates that during a pullback within an uptrend, the pullback was less severe in price terms than in momentum terms, suggesting the underlying trend is strong. |
| Hidden bearish divergence | The inverse. When price makes a lower high but RSI makes a higher high during a pullback within a downtrend. Signals trend continuation rather than reversal. |
| RSI swing failure | A pattern where RSI fails to reach overbought or oversold during a price move, suggesting the move lacks momentum. A bullish swing failure occurs when RSI reaches oversold, recovers, pulls back without reaching oversold again, then breaks above its prior peak. A bearish swing failure is the inverse. |
| Wilder's smoothing | The specific smoothing method Wilder used in the original RSI calculation. Wilder's smoothing is slightly different from exponential smoothing and produces slightly different values than implementations that use standard exponential moving averages. Most modern platforms including thinkorswim use Wilder's smoothing, but some platforms use exponential smoothing instead, producing slightly different RSI values. |
| Connor's RSI | A modified RSI variant developed by Larry Connors that uses shorter periods (typically 2 or 3) and combines RSI with additional momentum measurements. Designed for mean-reversion strategies on a much shorter timeframe than traditional RSI. We'll mention it for context but the lesson focuses on traditional RSI. |
| Stochastic RSI | An oscillator that applies the Stochastic calculation to RSI values rather than to price. Effectively a 'momentum of momentum' indicator that responds faster than standard RSI. Has its own specific use cases that we'll touch on briefly. |
What the Configuration Settings Actually Mean
- Length (or period). The number of bars used in the RSI calculation. The default is 14, following Wilder's original specification. Shorter periods produce a more sensitive RSI that responds faster to price changes — useful for shorter timeframes but generates more false signals. Longer periods produce a smoother RSI with fewer signals but more reliable ones. The 14-period default works for most applications and shouldn't be changed without specific reason.
- Price input. Which price from each bar is used in the calculation. The default is closing price, which works for almost all applications. Other choices (high, low, midpoint) are available but rarely improve results.
- Overbought level. The RSI value at which the indicator is considered overbought. The default is 70, following Wilder's original. Some traders adjust this to 80 for strong trending markets (where 70 gets reached too often) or 65 for ranging markets (where 70 isn't reached as often). The 70 default is appropriate for most applications.
- Oversold level. The RSI value at which the indicator is considered oversold. The default is 30, the mirror of the overbought level. Adjustments apply with the same logic as overbought.
- Centerline level. Typically set to 50. Some platforms allow this to be customized but 50 is the universally recognized midpoint.
- Show indicator histogram or line type variations. Most platforms allow RSI to be displayed as a simple line, as a line with shaded overbought/oversold zones, or with additional reference lines. These visualization choices don't change the calculation, only the visual presentation.
The Math Behind RSI
The RSI calculation involves several steps. Understanding what each step does reveals what RSI is actually measuring.
Step 1: Calculate gain and loss for each bar. For each bar in the lookback period, determine whether price rose or fell compared to the prior bar. If price rose, the gain equals the price difference and the loss equals zero. If price fell, the loss equals the absolute value of the price difference and the gain equals zero. Bars with no change have both gain and loss equal to zero.
Step 2: Calculate average gain and average loss. Across the lookback period (default 14 bars), calculate the average of the gains and the average of the losses. The first calculation uses simple averages; subsequent calculations use Wilder's smoothing, which works similarly to an exponential moving average but with a specific smoothing constant.
Step 3: Calculate relative strength (RS). Relative strength is the ratio of average gain to average loss:
Relative Strength
RS = Average Gain / Average Loss
If gains exceed losses, RS is greater than 1. If losses exceed gains, RS is less than 1. If gains and losses are equal, RS equals 1.
Step 4: Calculate RSI from RS. The final formula converts RS into a bounded value between 0 and 100:
RSI Formula
RSI = 100 − (100 / (1 + RS))
The formula has specific consequences. When RS equals 0 (all losses, no gains), RSI equals 0. When RS approaches infinity (all gains, no losses), RSI approaches 100. When RS equals 1 (equal gains and losses), RSI equals 50.
Suppose over the last 14 bars, the average gain is 1.5 and the average loss is 0.5: RS = 1.5 / 0.5 = 3 RSI = 100 − (100 / (1 + 3)) = 100 − (100 / 4) = 100 − 25 = 75 The RSI reads 75 — above the overbought level of 70. This means recent gains have substantially outweighed recent losses, putting RSI in overbought territory. Now suppose the next 14 bars show an average gain of 0.5 and an average loss of 1.5: RS = 0.5 / 1.5 = 0.333 RSI = 100 − (100 / (1 + 0.333)) = 100 − (100 / 1.333) = 100 − 75 = 25 The RSI now reads 25 — below the oversold level of 30. The relationship between gains and losses has reversed, and RSI reflects this reversal numerically.
RSI is fundamentally a ratio comparison between recent gains and recent losses. When gains dominate, RSI is high. When losses dominate, RSI is low. The 0-to-100 scale provides a standardized way to compare this gain/loss ratio across different securities, different timeframes, and different market conditions. The bounded nature (0 to 100) creates a specific behavioral property. RSI cannot trend indefinitely upward or downward — it must eventually pull back from extremes because the mathematical formula constrains it. This is the property that makes RSI useful for identifying potential reversals: when RSI is at an extreme, the indicator itself cannot continue moving in that direction at the same rate, even if price continues moving directionally.
Reading RSI in Trending Markets Versus Ranging Markets
The single most important point to understand about RSI is that its readings mean different things in trending markets than in ranging markets. Mechanical use of overbought/oversold levels across all market conditions produces poor results because the same RSI value carries different significance depending on the broader context.
- In ranging markets: RSI works approximately as the traditional interpretation suggests. When RSI reaches overbought (above 70), price often reverses downward toward the middle of the range. When RSI reaches oversold (below 30), price often reverses upward. Ranging markets are where the classic 'sell at overbought, buy at oversold' interpretation works best.
- In trending markets: RSI can remain in overbought or oversold territory for extended periods while the trend continues. During strong uptrends, RSI may stay above 70 for weeks while price continues making new highs. During strong downtrends, RSI may stay below 30 for weeks while price continues making new lows. Trading mechanical overbought/oversold signals during strong trends produces consistent losses because the signals fire repeatedly while the trend ignores them.
- Adjusted RSI levels for trending markets: Many practitioners adjust the overbought and oversold thresholds based on the trend. In strong uptrends, the effective oversold level might shift up to 40 (price pullbacks rarely take RSI all the way down to 30 during strong uptrends). In strong downtrends, the effective overbought level might shift down to 60. The adjustment reflects that during trends, the meaningful momentum extremes occur at different RSI values than in ranging markets.
In trending markets, the 50 level often becomes more meaningful than the overbought/oversold levels. During uptrends, pullbacks that find support at RSI 50 (or sometimes slightly below at 40) often mark continuation entries. During downtrends, rallies that find resistance at RSI 50 (or slightly above at 60) often mark continuation entries for short positions. The 50 level acts as a momentum boundary that bull or bear control typically maintains during trends.
RSI Divergence — The Most Valuable Signal
Divergence between RSI and price is the single most valuable signal RSI provides. While mechanical overbought/oversold readings produce mediocre results in most testing, divergence signals have substantially better historical reliability when properly identified and integrated with other analysis.
Bullish divergence in detail. A bullish divergence occurs when: Price makes a new low (lower than a prior low); RSI makes a higher low (above its prior corresponding low); the two-low comparison happens at corresponding swing points, not arbitrary moments. The interpretation: price action suggests continued bearish momentum (price made a new low), but the underlying momentum measurement disagrees (RSI failed to make a new low). The momentum behind the downtrend is fading even as price extends further down. This often precedes meaningful reversals because momentum changes typically lead price changes.
Bearish divergence in detail. Price makes a new high (higher than a prior high); RSI makes a lower high (below its prior corresponding high); the two-high comparison happens at corresponding swing points. The interpretation: price action suggests continued bullish momentum (price made a new high), but RSI signals that the underlying momentum is fading. The trend is becoming exhausted even as price continues higher.
Hidden divergences for trend continuation. Hidden bullish divergence (price makes higher low, RSI makes lower low during a pullback) suggests trend continuation rather than reversal. The pullback is more severe in momentum terms than in price terms, which counterintuitively signals trend strength — the underlying buyers are still active enough that price doesn't pull back as much as the momentum dip would suggest. Hidden bearish divergence (price makes lower high, RSI makes higher high) is the inverse, signaling downtrend continuation.
Divergences fire less often than overbought/oversold signals, which is part of why they're more reliable. A trader looking for divergences will find fewer signals but those signals will have higher quality on average. This trade-off between signal frequency and signal quality is one readers should explicitly understand: more selective signal identification typically produces better trading results than mechanical signal generation, even at the cost of trading less frequently.
Divergence signals are not infallible. Markets can produce extended divergences that persist for weeks or months before the eventual reversal, and during that extended period the trend can move substantially against the divergence's implied direction. Traders who enter at the first sign of divergence often take losses as the divergence extends. The disciplined approach uses divergence as one signal among many, with entry timing depending on additional confirmation from price action, candle patterns, or other indicators.
Pattern Statistics and Sources
QuantifiedStrategies' research on RSI concludes that it is one of the most useful indicators for trading strategies, but works best together with a second indicator or variable. Filters or additional criteria are needed for the RSI to be used effectively in a trading strategy — standalone RSI signals consistently underperform RSI signals integrated with other analysis.
QuantifiedStrategies' specific backtest of the classic 70-30 RSI strategy (buying when RSI dips below 30 and selling when RSI rises above 70) on the S&P 500 from 1993 to present found that the strategy with a 5-day lookback is not particularly reliable or profitable. This finding aligns with broader research showing that mechanical overbought/oversold trading produces mediocre results.
StockTiming's research on RSI effectiveness across market conditions finds that the indicator demonstrates particularly robust results in range-bound markets, where overbought and oversold signals achieve their highest reliability. Statistical evidence supports RSI's efficacy in mean-reverting markets where traders capitalize on momentum shifts at extreme readings.
The published research is consistent. RSI used as a mechanical overbought/oversold signal produces mediocre results, particularly in trending markets. RSI integrated with other analysis — divergence patterns combined with price action, RSI combined with moving averages or trend indicators, RSI used with awareness of market regime — produces substantially better results. Research showing 91% win rates exists but those results come from specific multi-factor strategies that use RSI as one component rather than from standalone RSI signals.
- J. Welles Wilder Jr.'s original book 'New Concepts in Technical Trading Systems' (1978) — the foundational source with the original specification
- quantifiedstrategies.com — extensive backtested research on multiple RSI applications with specific reliability figures
- liberatedstocktrader.com — research on RSI variants and settings
- stocktiming.com — analysis of RSI effectiveness across market conditions
- Academic literature via Google Scholar — search 'relative strength index,' 'RSI divergence,' 'RSI momentum oscillator'
- Constance Brown's 'Technical Analysis for the Trading Professional' — extensive coverage of advanced RSI applications including her work on RSI ranges in trending markets
Common Student Mistakes with RSI
- Trading mechanical overbought/oversold signals. The most common mistake. Mechanical 'sell at 70, buy at 30' trading produces mediocre results, particularly in trending markets where RSI can remain in extreme territory for extended periods while the trend continues. The research consistently confirms this finding.
- Ignoring market regime. RSI works differently in trending markets than in ranging markets. Using the same RSI interpretation across both conditions produces inconsistent results. Readers should specifically identify whether the market is trending (use 50-level support/resistance and divergences) or ranging (use traditional overbought/oversold) before applying RSI signals.
- Missing divergences. RSI divergence is the indicator's most valuable signal, but it requires careful identification — corresponding swing points in price and RSI, both lows or both highs, with the divergence visible as a clear directional disagreement. Many traders watch for overbought/oversold readings and miss divergences that are forming.
- Entering immediately at divergence appearance. Divergences can extend for weeks or months before resolving. Entering at the first sign of divergence often produces losses as the divergence persists and price continues against the divergence's implied direction. Disciplined traders wait for additional confirmation (candle pattern, support/resistance break, or other indicator agreement) before acting on divergence.
- Confusing hidden divergences with regular divergences. Hidden divergence signals trend continuation, not reversal. Regular divergence signals potential reversal. Misidentifying which type is present produces trades in the wrong direction.
- Using RSI as the only indicator. RSI's value comes through integration with other analysis. Traders who use RSI alone as their primary signal tool consistently underperform traders who integrate RSI with price action, moving averages, and other tools.
- Adjusting RSI settings to fit recent results. When RSI signals haven't worked recently, the temptation is to change the period from 14 to 9 or 21, or to change the thresholds from 70/30 to 80/20. This curve-fitting behavior typically produces worse forward results because the changes reflect adaptation to recent noise rather than genuine improvement. The 14-period default and 70/30 thresholds exist because they work across most conditions; specific adjustments should come from documented backtesting on out-of-sample data, not from frustration with recent signals.
- Treating RSI 50 as just a number rather than a structural level. During trends, the RSI 50 level often acts as meaningful momentum support or resistance. Bullish trends typically maintain RSI above 50 with pullbacks finding support there. Bearish trends typically maintain RSI below 50 with rallies finding resistance there. Traders who don't watch the 50 level miss important confirmation information.
- Misinterpreting persistent overbought/oversold as automatic reversal signals. In strong trends, RSI can stay in overbought or oversold territory for extended periods while the trend continues. Persistent extreme readings during strong trends are signals of trend strength, not signals of imminent reversal.
Reading RSI Integrated with Prior Lessons
The integrated chart for this lesson continues the progressive integration principle. The chart includes candle patterns from the early lessons, a chart pattern from the 14-28 range, the moving average tools from prior technical analysis lessons, and now RSI as the new tool.
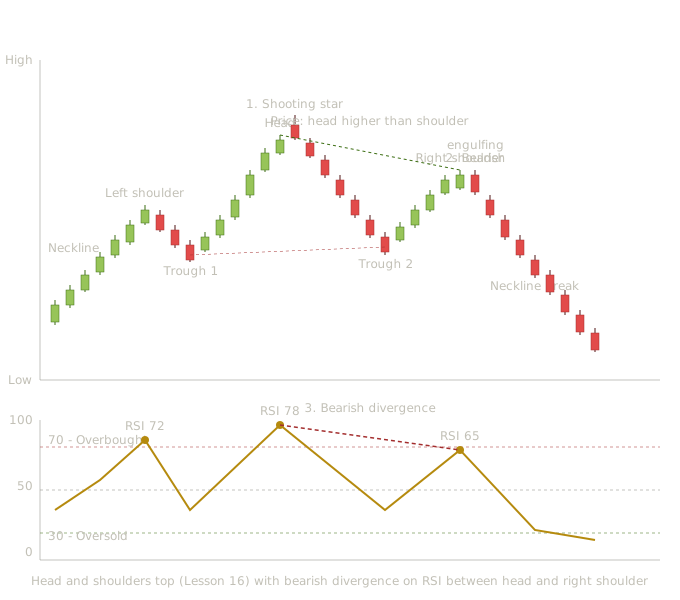
Head and shoulders top (Lesson 16) with shooting star at head, bearish engulfing at right shoulder, and bearish RSI divergence between head and right shoulder peaks — progressive integration of candle patterns, chart patterns, and RSI
This chart shows what the integrated reading looks like with RSI added below the main price chart. The chart includes a head and shoulders top pattern from Lesson 16, two named candle patterns from Lessons 1-13 (shooting star and bearish engulfing), and the RSI oscillator with a clear bearish divergence between the head and right shoulder peaks.
The early uptrend (candles 1-7). Seven bullish candles drive price up establishing the prior uptrend that will eventually reverse through the head and shoulders pattern. The RSI is rising into overbought territory as the rally develops, eventually reaching 72 at the left shoulder peak.
The left shoulder (candle 7). A small-body candle marks the left shoulder's peak. RSI reads 72 at this moment — overbought but not extremely so. The location of the left shoulder relative to the trend matters: it's the first sign that the uptrend may be reaching exhaustion, but in itself it's just one peak that could easily be exceeded.
The first trough decline (candles 8-10). Three bearish candles drive price down from the left shoulder to the first trough that establishes the neckline level. RSI pulls back as price declines. The pullback is normal trend behavior — not yet signaling reversal.
The rally to the head (candles 11-15). Five bullish candles drive price up to a higher peak than the left shoulder. This is the head of the head and shoulders pattern. RSI reads 78 at the head's peak — higher than the 72 at the left shoulder, which is exactly what we'd expect when price makes a new high. The momentum confirms the new high.
A shooting star forms at the absolute peak. From Lesson 3, this is the canonical bearish reversal candle. From Lesson 16, this is the structural top of the head and shoulders. From RSI perspective, this peak coincides with the highest RSI reading of 78, which represents the maximum extension of the trend's momentum.
The shooting star at the head with RSI at its extreme is a high-conviction reversal signal. Three analytical layers all suggest that the trend is exhausting at this peak.
The decline to the second trough (candles 17-22). Six bearish candles drive price down to the neckline area, completing the descent from the head. RSI declines toward 50, signaling that the bullish momentum has decisively faded.
The second trough (candle 22). Price reaches approximately the same level as the first trough, establishing the neckline. RSI is now at 50 — the centerline. The market is at a critical juncture where it must decide whether to break down through the neckline (confirming the head and shoulders) or rally to a higher high (potentially invalidating the pattern).
The rally to the right shoulder (candles 23-26). Four bullish candles drive price up to what becomes the right shoulder. Importantly, the right shoulder forms at a level lower than the head — this is the structural requirement of a valid head and shoulders top.
Watch the RSI during this rally to the right shoulder. RSI reads 65 at the right shoulder peak. Compare this to the head's RSI reading of 78. Even though price was lower at the right shoulder than at the head, RSI is also lower at the right shoulder. But here's what's specifically meaningful: the RSI decline from 78 to 65 between the head and right shoulder peaks is proportionally larger than the price decline. The momentum is fading faster than the price.
This is bearish divergence (Signal 3 in the chart) — price made a lower high (right shoulder lower than head), but the momentum indicator shows that the underlying buying pressure has weakened substantially even at this lower high. The trend is structurally exhausted.
A long bearish candle opens above the prior bullish candle's close and falls powerfully to engulf its body. From Lesson 5, this is the bearish engulfing pattern at the right shoulder location. Combined with the bearish divergence on RSI, this candle provides the timing trigger for the head and shoulders pattern's eventual completion.
The decline to the neckline break (candles 28-33). Six bearish candles drive price decisively below the neckline. RSI continues to fall through 50 and into oversold territory. The head and shoulders has now completed structurally, the candle pattern at the right shoulder confirmed the reversal, and the RSI divergence had warned several candles in advance that this completion was likely.
Continued decline (candles 34-37). Four more bearish candles continue the post-pattern decline. The measured-move target from the head and shoulders projects further downside from the neckline level. RSI remains in oversold territory throughout, but the trend continues — exactly the 'RSI can stay oversold during strong trends' behavior we discussed.
What this integrated chart teaches together. Several pedagogical points emerge.
RSI divergence often precedes structural pattern completion. The bearish divergence between the head and right shoulder appeared before the right shoulder formed completely and well before the neckline broke. A trader watching only the price chart wouldn't have known the trend was exhausting until much later. The RSI divergence provided advance warning of the exhaustion that the chart pattern eventually confirmed.
Multi-layer signals at structural moments dramatically increase conviction. The shooting star at the head with RSI at extreme overbought is one moment of confluence. The bearish engulfing at the right shoulder with bearish RSI divergence is another moment of confluence. Each of these moments combines candle pattern, chart pattern position, and RSI signal simultaneously — exactly the kind of multi-dimensional setup that defines the curriculum's integrated framework.
RSI in oversold territory during the post-breakout decline doesn't signal reversal. Notice that RSI remained in oversold territory throughout the decline after the neckline break. A trader using mechanical oversold reading would have bought repeatedly during this decline and taken repeated losses. The integrated reader recognizes that strong downtrends produce extended oversold readings and waits for divergence or other signals before fading the downtrend.
The progressive integration continues. This chart includes patterns from Lessons 1-13 (candle patterns), Lesson 16 (head and shoulders top from the chart pattern section), and the new RSI material from Lesson 34. The framework keeps building.
Making Trading Decisions with RSI in Real Time
The real-time decision-making walkthrough shows how RSI integrates with the other analytical layers.
At the left shoulder. A trader sees RSI reaching 72 (overbought) at the left shoulder peak. This is potentially significant — the trend is reaching momentum extremes — but it's also just one peak. Most traders wouldn't act on this signal alone because the head and shoulders pattern hasn't yet formed. The appropriate action is to note the overbought reading and watch what happens next.
At the head peak with shooting star and RSI at 78. This is a meaningful confluence. Bearish candle pattern, extreme RSI reading, potential head of a developing head and shoulders. Some aggressive traders take a small short position here based on this confluence. Conservative traders wait for more confirmation. Either approach is reasonable.
At the right shoulder formation. This is where the RSI bearish divergence becomes visible. Comparing the head's RSI (78) to the right shoulder's RSI (65), the divergence is clear. A trader using divergence-based RSI analysis recognizes this and prepares for short entry.
At the bearish engulfing at the right shoulder. High-conviction short entry. The candle pattern at the right shoulder, combined with the bearish RSI divergence, combined with the developing head and shoulders structure, creates multi-layer confluence. Position size should reflect the confluence strength. Stop placement above the right shoulder's high (since exceeding the right shoulder's high would invalidate the head and shoulders pattern).
At the neckline break. Confirmation that the pattern has completed structurally. Traders who didn't enter at the right shoulder have one more entry opportunity here with more pattern confirmation but worse cost basis. The standard trade-off applies.
During the post-breakout decline. RSI moves into oversold territory. A trader who didn't understand market regimes might try to buy the oversold reading expecting a bounce. The integrated trader recognizes that during a confirmed downtrend after a head and shoulders breakout, oversold RSI is normal and doesn't signal reversal. They hold their short position toward the measured-move target.
RSI signals don't always produce optimal outcomes. The bearish divergence in this chart resolved into a complete pattern; another bearish divergence in another chart might produce a brief pullback that doesn't sustain into a meaningful reversal. Divergences are probabilistic signals, not guarantees. Taking the signal at confluence is the right action even though individual instances vary in outcome quality. The systematic discipline of acting on confluence signals — including this RSI divergence — is what produces consistent results over time.
How This Lesson Connects to What Comes Next
Lesson 35 covers MACD (Moving Average Convergence Divergence), the other major momentum oscillator that's been a staple of technical analysis since Gerald Appel developed it in the late 1970s. MACD has a different conceptual basis than RSI — it's built from moving average differences rather than gain/loss ratios — but serves similar purposes in identifying momentum changes and divergences.
Together, RSI and MACD form the foundation of momentum-based technical analysis. Most traders who use momentum oscillators use one or both of these tools. The lessons covering each will give readers a complete understanding of how to read momentum, and the lessons after that will cover the other momentum oscillators (Stochastic, Williams %R, CCI) that complement these foundational tools.
Key Takeaways
- RSI measures the speed and magnitude of price changes by comparing recent gains to recent losses — this is fundamentally different from moving averages (which measure price level) and Bollinger Bands (which measure price extremes)
- The RSI formula: RS = Average Gain / Average Loss, then RSI = 100 − (100 / (1 + RS)) — produces a bounded 0-100 oscillator where 50 represents equal gains and losses
- Overbought/oversold readings mean different things in different market regimes — in strong trends, RSI can remain overbought or oversold for extended periods while the trend continues
- RSI divergence (price makes new extreme but RSI makes less extreme reading) is the indicator's most valuable signal, detecting momentum fading before price confirms the reversal
- Hidden divergence signals trend continuation rather than reversal — price makes higher low while RSI makes lower low (hidden bullish) or price makes lower high while RSI makes higher high (hidden bearish)
- Standalone RSI overbought/oversold signals produce mediocre results; RSI integrated with price action, chart patterns, and other indicators produces substantially better outcomes
Quiz — 3 Questions
Answer one at a timeA stock's 14-bar average gain is 2.0 and its average loss is 1.0. What is the RSI reading, and what does it indicate?
In this lesson
400 — Technical Indicators — Integration and Methodology