Fibonacci Retracements
Fibonacci retracements are drawing tools rather than calculated indicators — the trader identifies a meaningful price swing and draws horizontal levels at specific mathematical ratios. These levels often act as support or resistance during pullbacks, and their reliability increases substantially when they align with other structural references.
- Explain the mathematical basis for the 23.6%, 38.2%, 50%, 61.8%, and 78.6% retracement levels
- Draw Fibonacci retracements correctly: direction matters, anchors determine validity
- Identify which retracement levels to expect in strong versus weakening trends
- Recognize confluence when multiple Fibonacci levels or other structural references align
- Explain why the 50% level is included despite not being a true Fibonacci ratio
- Integrate Fibonacci levels with candle patterns, moving averages, and chart pattern structures
Drawing Tools vs. Calculated Indicators
Fibonacci retracements are drawing tools rather than calculated indicators. The trader manually identifies a meaningful price swing on the chart and draws Fibonacci levels between the swing's high and low points. The resulting horizontal levels — at specific mathematical ratios — often act as support or resistance during subsequent pullbacks or rallies. Unlike the indicators we've covered, Fibonacci retracements involve trader judgment in the swing identification, which is both their main strength (flexibility to adapt to different chart structures) and their main weakness (different traders draw different swings, producing different levels).
The conceptual basis for Fibonacci tools comes from the Fibonacci sequence — the famous mathematical series where each number is the sum of the two preceding numbers (1, 1, 2, 3, 5, 8, 13, 21, 34, 55, 89, 144...). The ratios between consecutive Fibonacci numbers approach specific values: 1.618 (the golden ratio, often called Phi), its inverse 0.618, and several related ratios. These ratios appear remarkably often in natural systems — flower petal arrangements, spiral shell shapes, galaxy structures — and many technical analysts believe they appear in financial markets as well because markets reflect collective human psychology, which apparently exhibits Fibonacci-like preferences for certain proportions.
Whether this metaphysical reasoning is correct or whether Fibonacci levels work because so many traders watch them (self-fulfilling prophecy), the levels do appear to function as structural reference points on charts. This lesson covers what Fibonacci retracement is, how to draw it correctly, the specific levels and what they represent, common mistakes that destroy traders who use it mechanically, and how to integrate it with the broader analytical framework.
Vocabulary
| Term | Definition |
|---|---|
| Fibonacci sequence | The mathematical series 1, 1, 2, 3, 5, 8, 13, 21, 34, 55, 89, 144, 233, 377, 610, 987 and so on. Each number is the sum of the two preceding numbers. Discovered (or rediscovered in the West) by Leonardo of Pisa, also known as Fibonacci, in the early 13th century. |
| Golden ratio (Phi) | Approximately 1.618. The ratio that consecutive Fibonacci numbers approach as the sequence extends. Has unique mathematical properties and appears in many natural systems. |
| Fibonacci retracement | A drawing tool that identifies potential support and resistance levels based on Fibonacci ratios applied to a measured price swing. The retracement levels are typically displayed at 23.6%, 38.2%, 50%, 61.8%, and 78.6% of the measured swing's range. |
| 23.6% level | The shallowest standard Fibonacci retracement. Often acts as support in strong trends where pullbacks are minimal. Calculated from the ratio derived by dividing a Fibonacci number by the number three places higher in the sequence. |
| 38.2% level | A common moderate retracement level. Represents pullbacks of roughly one-third of the prior move. Calculated from the inverse golden ratio relationship (1 - 0.618). |
| 50% level | Not technically a Fibonacci ratio but included in most Fibonacci retracement tools because of its psychological significance. Represents pullbacks of half the prior move. Often acts as meaningful support or resistance. |
| 61.8% level | The most important Fibonacci retracement level. The inverse of the golden ratio (1 / 1.618). Pullbacks to 61.8% represent substantial corrections that test trend integrity — pullbacks deeper than this often signal trend reversal rather than continuation. |
| 78.6% level | The deepest standard Fibonacci retracement. The square root of 0.618. Pullbacks to 78.6% represent very deep corrections that often mark the boundary between continuation and reversal. |
| Swing high | The highest point of a measured price move. Used as one anchor point for drawing Fibonacci retracement. |
| Swing low | The lowest point of a measured price move. Used as the other anchor point. |
| Retracement | A temporary reversal in price that occurs within a larger trend before the trend resumes. Fibonacci retracement tools are designed to predict where these temporary reversals will find support (in uptrends) or resistance (in downtrends). |
| Drawing direction | When drawing Fibonacci retracement, the direction matters. For uptrends, draw from swing low (0%) to swing high (100%) — the retracement levels then appear below the swing high as potential support during pullbacks. For downtrends, draw from swing high (0%) to swing low (100%) — the levels appear above the swing low as potential resistance during rallies. |
| Confluence | When multiple Fibonacci retracement levels from different swings align with each other at approximately the same price. Confluence levels often act as stronger support or resistance than single-swing Fibonacci levels. |
| Failed Fibonacci level | When price moves through a Fibonacci level without pausing or reversing. Failed levels often lead to price moving to the next deeper Fibonacci level. |
What the Configuration Settings Actually Mean
When a reader adds Fibonacci retracement to a chart, several configurable elements appear.
- Anchor points. The trader must identify two points on the chart — typically the swing low and swing high (or vice versa) of a meaningful move. The choice of these anchor points is the most consequential decision in Fibonacci analysis. Different anchor selections produce different level structures, which is why Fibonacci has more subjectivity than calculated indicators.
- Visible levels. Most platforms display 23.6%, 38.2%, 50%, 61.8%, and 78.6% as standard. Additional levels (like 14.6%, 88.6%) can be added but rarely improve analysis. Some traders also display the 100% level (the swing's starting point) and 0% level (the swing's ending point) for full context.
- Line style and color. Visual settings that don't affect the analysis. Most traders use consistent colors for Fibonacci tools so they're immediately recognizable on charts.
- Extension to right side. Whether the Fibonacci levels extend rightward as horizontal lines into the future on the chart, or only show as marks at the anchor points. Most traders extend them as horizontal lines so they serve as ongoing reference levels.
The Math Behind Fibonacci Ratios
The Fibonacci ratios that produce the retracement levels come from specific mathematical relationships within the Fibonacci sequence.
- The golden ratio. Dividing any Fibonacci number by the previous Fibonacci number approaches 1.618 as the sequence extends. For example: 21/13 = 1.615, 34/21 = 1.619, 55/34 = 1.618, 89/55 = 1.618. The ratio stabilizes at 1.618 (the golden ratio Phi).
- The inverse golden ratio. Dividing any Fibonacci number by the next Fibonacci number approaches 0.618 (the inverse of 1.618). For example: 13/21 = 0.619, 21/34 = 0.618, 34/55 = 0.618. This 0.618 produces the 61.8% retracement level.
- The 38.2% level. Dividing a Fibonacci number by the number two places higher approaches 0.382. For example: 13/34 = 0.382, 21/55 = 0.382. This produces the 38.2% retracement level. Mathematically, 0.382 = 1 - 0.618.
- The 23.6% level. Dividing a Fibonacci number by the number three places higher approaches 0.236. For example: 13/55 = 0.236, 21/89 = 0.236. This produces the 23.6% retracement level.
- The 78.6% level. The square root of 0.618 equals 0.786, producing the 78.6% retracement level.
- The 50% level. Mathematically not a Fibonacci ratio. Included in most Fibonacci tools because of its psychological significance — exactly half a move is a meaningful reference point that traders watch for. Some Fibonacci purists argue against including it, but its psychological significance has made it standard.
Suppose a stock rallies from $50 to $100 — a $50 move. The Fibonacci retracement levels below $100 would be: 23.6% level: $100 − ($50 × 0.236) = $100 − $11.80 = $88.20 38.2% level: $100 − ($50 × 0.382) = $100 − $19.10 = $80.90 50.0% level: $100 − ($50 × 0.500) = $100 − $25.00 = $75.00 61.8% level: $100 − ($50 × 0.618) = $100 − $30.90 = $69.10 78.6% level: $100 − ($50 × 0.786) = $100 − $39.30 = $60.70 These levels become potential support areas during pullbacks within the uptrend. The 23.6% level represents shallow pullbacks (price holding strength); the 78.6% level represents deep pullbacks (trend health questionable beyond this point).
Reading Fibonacci Retracement in Context
Identifying meaningful swings. The first and most important skill is identifying the swings worth drawing Fibonacci on. Tiny price oscillations don't deserve Fibonacci analysis — the retracement levels would be too close together to provide useful reference. Major moves with clear swing highs and lows are the appropriate candidates. As a rule of thumb, the move should be at least 10-20% of recent price range on whatever timeframe you're analyzing.
Drawing from the right anchor points. For uptrends, draw from the most recent significant swing low to the swing high. For downtrends, draw from the swing high to the swing low. The drawing should capture the complete move you want to analyze, not just part of it.
- Which level to expect for support. In strong uptrends with substantial momentum, pullbacks often stop at the 23.6% or 38.2% levels — shallow pullbacks reflect strong buyer interest that doesn't let price decline far. In healthy but not extreme uptrends, the 50% and 61.8% levels are common. In weakening uptrends, deeper retracements to 78.6% may occur — though pullbacks this deep often signal that the trend is structurally weakening and may not resume.
- Confluence with other levels. Fibonacci levels become substantially more reliable when they align with other structural references. A 61.8% retracement that also coincides with a prior swing high (now acting as support after being broken), a major moving average, or a chart pattern's neckline carries much more weight than a 61.8% level in isolation.
- Failed Fibonacci levels. When price moves through a Fibonacci level without significant pause or reversal, the level 'failed' as support or resistance. Failed levels typically lead to price reaching the next deeper Fibonacci level. A bullish move that fails at the 38.2% level often retraces to 50% or 61.8% before finding genuine support.
Pattern Statistics and Sources
The published research on Fibonacci retracement is mixed and methodologically challenging because of the subjectivity in swing identification. Different researchers drawing Fibonacci on the same chart often draw different swings, producing different levels, and reporting different reliability figures. This methodological problem makes Fibonacci research less definitive than research on calculated indicators.
Despite this challenge, several findings emerge consistently. Fibonacci retracement levels show statistically significant tendency to act as support and resistance — price reverses at Fibonacci levels more often than chance would predict. The strongest reliability comes from the 61.8% level (the actual golden ratio). The 50% level shows reliability primarily because of its psychological significance rather than mathematical Fibonacci basis. Fibonacci levels work better when combined with other technical analysis than as standalone signals. The reliability is particularly strong when Fibonacci levels align with other structural references (chart pattern levels, moving averages, prior support/resistance).
- Robert Fischer's 'Fibonacci Applications and Strategies for Traders' — comprehensive coverage of Fibonacci tools
- Constance Brown's 'Technical Analysis for the Trading Professional' — advanced Fibonacci applications
- W.D. Gann's various publications — Gann's work overlaps with Fibonacci through his focus on price-time relationships
- TradingView educational materials — practical Fibonacci application examples
- Academic literature via Google Scholar — search 'Fibonacci retracement,' 'golden ratio in markets,' 'Fibonacci levels statistical significance'
Common Student Mistakes with Fibonacci Retracement
- Drawing from arbitrary points. The most common mistake. Fibonacci retracement requires meaningful swing highs and lows as anchors. Drawing from random points or from minor pivots produces meaningless levels that don't reflect real market structure.
- Treating Fibonacci levels as exact targets. Levels typically work as approximate zones rather than exact prices. Price reaching the 61.8% level isn't required to stop within a few cents of the calculated value — it might stop a few percent above or below. The level provides a reference zone, not a precise price target.
- Forcing Fibonacci analysis on every swing. Not every price move benefits from Fibonacci analysis. Small consolidations, choppy price action, and ranging markets don't produce reliable Fibonacci levels. Reserve the analysis for substantial directional moves.
- Drawing multiple Fibonacci retracements simultaneously without confluence checking. Each Fibonacci drawing produces its own set of levels. Drawing several on the same chart without checking for confluence produces visual chaos. The valuable analysis comes from identifying where multiple Fibonacci drawings agree, not from displaying all of them simultaneously.
- Treating the 50% level as a Fibonacci ratio. It isn't mathematically. The 50% level works because of its psychological significance, not because of Fibonacci mathematics. Understanding this distinction matters for proper expectations.
- Relying on Fibonacci alone for entries. Like every other tool we've covered, Fibonacci works better as confluence than as standalone signal. Entering trades at Fibonacci levels without other analysis confirming the entry produces mediocre results.
- Ignoring failed Fibonacci levels. When price moves through a Fibonacci level decisively without reversal, the level failed. Continuing to expect support or resistance at that failed level after the breach produces losses.
Reading Fibonacci Retracements Integrated with Prior Lessons
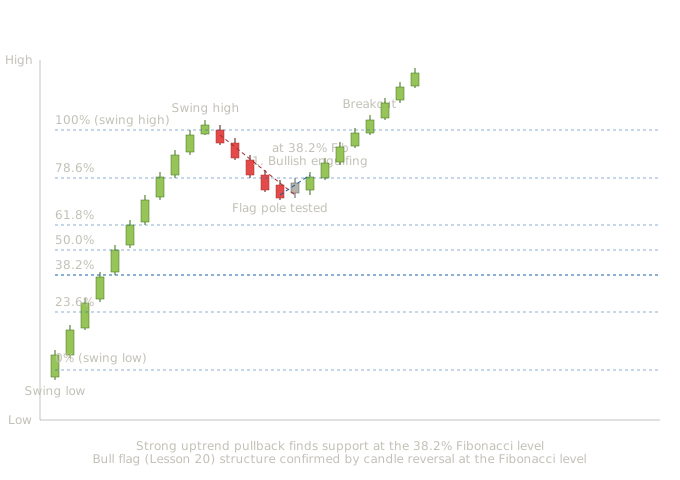
Bull flag (Lesson 20) with bullish engulfing at the 38.2% Fibonacci retracement level (Lesson 5) — showing candle pattern, chart pattern, and Fibonacci confluence creating a high-conviction continuation entry
This chart shows what the integrated reading looks like with Fibonacci retracement added. The chart includes a bull flag continuation pattern from Lesson 20, a bullish engulfing candle from Lesson 5, and Fibonacci retracement levels providing structural reference for the flag's expected support.
The strong uptrend (candles 1-11). Eleven bullish candles drive price from the swing low to the swing high. This is the canonical bull flag pole — a strong, fast directional move that establishes the trend that the eventual flag will consolidate within.
Drawing the Fibonacci retracement. The retracement is drawn from the swing low (the bottom of the rally) to the swing high (the top of the rally). The levels appear as horizontal lines at 23.6%, 38.2%, 50%, 61.8%, and 78.6% of the swing's range. These become the potential support levels where the eventual pullback might find buying interest.
The flag consolidation begins (candles 12-17). Six bearish candles drive price down from the swing high in the typical flag pullback pattern. The decline is moderate — the bodies are smaller than the trend candles, signaling normal profit-taking rather than aggressive selling.
Price reaches the 38.2% Fibonacci level. The decline finds support precisely at the 38.2% retracement level. This is the kind of confluence that gives Fibonacci levels their value — a strong uptrend pulling back to the 38.2% level (often considered the "shallow" retracement appropriate for strong trends) demonstrates the trend's underlying strength.
Small body at the support (candle 18). A small-body candle forms at the 38.2% level, showing seller exhaustion at the structural support. This is the indecision candle that often precedes directional resumption.
A bullish engulfing pattern completes at exactly the Fibonacci level. The candle reversal pattern at the structural Fibonacci support creates multi-layer confluence — chart pattern (bull flag), candle pattern (bullish engulfing), and Fibonacci level all aligning at the same moment.
The breakout and trend continuation (candles 20-25). Six bullish candles drive price up through the bull flag's resistance and beyond the swing high. The flag pattern has completed, the Fibonacci level held, and the trend has resumed.
What this integrated chart teaches together. Several pedagogical points emerge.
Fibonacci levels work best as part of multi-dimensional confluence. The 38.2% level alone might have held or failed. The 38.2% level combined with the bull flag structure plus the bullish engulfing candle creates the kind of confluence that produces high-conviction setups.
Strong trends typically retrace shallowly. The 38.2% retracement represents a shallow pullback that's typical of strong trends. Pullbacks to deeper Fibonacci levels (61.8%, 78.6%) often signal weakening trends. The depth of retracement is itself diagnostic information about trend health.
Drawing Fibonacci on meaningful swings matters. The bull flag analysis required identifying the prior swing's low and high as the appropriate anchors. Drawing Fibonacci on smaller, less meaningful price movements would have produced less reliable levels.
Integration with Prior Lessons
Fibonacci retracement integrates powerfully with everything the curriculum has built. Candle reversal patterns at Fibonacci levels are higher-conviction signals than the same candles at random levels. Chart pattern necklines that align with Fibonacci levels add structural significance to both. Moving averages that intersect with Fibonacci levels create dynamic-plus-static support zones that often hold reliably. The integrated reading combines Fibonacci as one more layer in multi-dimensional analysis.
How This Lesson Connects to What Comes Next
Lesson 40 covers Fibonacci extensions and projections — the tools that identify where price might go beyond the original swing rather than just where pullbacks might find support. Extensions are particularly useful for setting profit targets, identifying where breakouts might exhaust, and projecting measured-move targets. The combination of retracements (Lesson 39) and extensions (Lesson 40) covers the major Fibonacci applications working traders use.
Key Takeaways
- Fibonacci ratios come from the mathematical sequence: 61.8% = inverse of golden ratio (1/1.618), 38.2% = 1 minus 61.8%, 23.6% = Fibonacci number divided by number three places higher, 78.6% = square root of 0.618
- The 50% level is not mathematically a Fibonacci ratio — it's included because of its psychological significance as the exact midpoint of a move
- Drawing direction matters: for uptrends, draw from swing low to swing high; for downtrends, draw from swing high to swing low
- The 61.8% level is the most important retracement level — the actual golden ratio — and consistently shows the strongest statistical tendency to act as support or resistance
- Fibonacci levels work as approximate zones not exact prices; confluence between Fibonacci levels and other structural references (moving averages, prior support/resistance, chart pattern levels) substantially increases reliability
- Failed Fibonacci levels — where price moves through without pausing — typically lead to price reaching the next deeper level; watching for this progression prevents holding to an already-failed level
Quiz — 3 Questions
Answer one at a timeA stock rallies from $60 to $90. During the subsequent pullback, a trader wants to identify the 61.8% Fibonacci retracement level. What price level does this correspond to, and why is the 61.8% level considered the most important retracement level?
In this lesson
400 — Technical Indicators — Integration and Methodology