Volume Analysis Tools: OBV, VWAP, and Money Flow Index
Volume is the second dimension of every bar on a chart. OBV tracks accumulated buying versus selling pressure, VWAP provides the session's volume-weighted price benchmark, and MFI adds volume weighting to momentum analysis. Together they answer different questions that price alone cannot.
- Explain why price movement on heavy volume carries different significance than the same movement on light volume
- Calculate OBV across a series of bars and identify what the trend in OBV reveals about price action
- Calculate VWAP given typical prices and volumes for a session's bars
- Explain why MFI is called 'volume-weighted RSI' and how volume weighting changes its readings
- Identify OBV divergence and explain what accumulation and distribution patterns signal
- Recognize when VWAP is appropriate versus when anchored VWAP is more useful
Why Volume Adds a Dimension Price Cannot Provide
Volume is the second dimension of every bar on a chart. Every candle shows price information (open, high, low, close) and volume information (how many shares or contracts traded during that bar). The candle and chart pattern lessons throughout this curriculum have referenced volume in passing — pattern statistics improve when volume confirms the pattern, breakouts are more reliable on heavy volume, divergence between price and volume warns of trend exhaustion — but we haven't yet covered the specific tools that turn volume into systematic analysis.
This lesson covers three foundational volume tools that the thinkorswim platform groups under Popular Studies and Market Strength Studies: On-Balance Volume (OBV), Volume-Weighted Average Price (VWAP), and Money Flow Index (MFI). These three tools answer different questions about volume. OBV tracks the accumulated buying versus selling pressure across time. VWAP shows the average price weighted by volume during a specific session. MFI combines volume with price to identify overbought and oversold conditions weighted by participation. Together they form the foundation of volume-based technical analysis.
The conceptual insight that makes volume analysis useful: price movement on heavy volume reflects broad market consensus, while price movement on light volume reflects narrow participation that often reverses. A stock rallying on heavy volume has many buyers committed to the move; a stock rallying on light volume might just be a few orders pushing price up in the absence of sellers. The same price movement carries different significance depending on the volume that accompanied it.
Vocabulary
| Term | Definition |
|---|---|
| Volume | The number of shares (for stocks) or contracts (for futures and options) traded during each bar. Displayed in thinkorswim as bars below the price chart, with each bar showing the total volume for that period. Volume is the raw input that all volume-based indicators process. |
| On-Balance Volume (OBV) | A cumulative volume indicator developed by Joseph Granville in 1963. Adds volume on bars that close up and subtracts volume on bars that close down, producing a running total that reflects the net accumulated buying versus selling pressure across time. OBV is unbounded — it can rise or fall to any value depending on accumulated history. |
| Volume-Weighted Average Price (VWAP) | The average price weighted by volume, calculated typically across a single trading session. Each price is multiplied by the volume at that price, and the products are summed and divided by total volume. Used heavily by institutional traders as a benchmark for execution quality and by day traders as a reference level for intraday support and resistance. |
| Money Flow Index (MFI) | A momentum oscillator that incorporates volume into its calculation. Often called 'volume-weighted RSI' because the structure parallels RSI but uses money flow (price × volume) instead of just price. Scaled from 0 to 100 with overbought above 80 and oversold below 20. |
| Accumulation | When buyers are systematically taking positions, often visible as rising OBV during periods of sideways or slightly declining price. Suggests that informed money is positioning before an expected upward move. |
| Distribution | The inverse. When sellers are systematically reducing positions, often visible as falling OBV during periods of sideways or slightly rising price. Suggests informed money is exiting before an expected downward move. |
| Volume divergence | When volume-based indicators diverge from price action. Bullish volume divergence: price makes lower lows but OBV or MFI makes higher lows. Bearish volume divergence: price makes higher highs but volume indicators make lower highs. |
| Volume confirmation | When volume increases on bars in the direction of a trend or breakout, confirming that broad participation supports the move. Strong volume on breakouts is one of the most important confirmation signals in technical analysis. |
| Volume contraction | When volume decreases over time, often during consolidation patterns. The Bollinger squeeze concept from Lesson 33 has a volume analogue — volume contracting during a triangle, flag, or rectangle often precedes a meaningful breakout. |
| Anchored VWAP | A variant of VWAP where the calculation starts from a specific anchor point chosen by the trader (an earnings date, a swing high, a major news event) rather than from the start of the trading session. Provides VWAP-based reference levels relative to structural moments rather than just session boundaries. |
| Volume profile | A separate volume tool (covered briefly in this lesson, more extensively in advanced material) that displays volume distribution at each price level rather than across time. Shows where the most trading activity has occurred and identifies high-volume areas that often act as support or resistance. |
| Money flow | The product of typical price and volume for each bar. Typical price is usually calculated as (high + low + close) / 3. Money flow represents the dollar value of trading activity rather than just the share count. |
| Positive money flow | Money flow on bars where the typical price closed higher than the prior bar's typical price. |
| Negative money flow | Money flow on bars where the typical price closed lower than the prior bar's typical price. |
| Money flow ratio | Positive money flow divided by negative money flow over the lookback period. The core ratio that MFI uses, similar to how RSI uses the gain/loss ratio. |
What the Configuration Settings Actually Mean
When a reader adds these tools to a chart, several configurable parameters appear for each.
- OBV settings. OBV's calculation has no period parameter — it accumulates volume continuously from whenever the chart begins. The only configurable settings are visual (line color, line style). This makes OBV one of the simplest indicators to use: no settings to optimize, no parameters to second-guess.
- VWAP settings. Standard VWAP resets at the start of each trading session. Anchored VWAP allows the trader to specify an anchor point. Most platforms offer additional configurable bands around VWAP (typically 1, 2, and 3 standard deviations) that act similarly to Bollinger Bands but centered on VWAP rather than a moving average.
- MFI settings. Period (default 14, matching RSI's default), with the same considerations as RSI period selection. Overbought and oversold thresholds (defaults 80 and 20 rather than RSI's 70 and 30, reflecting MFI's tendency to reach more extreme readings). Some platforms allow customization of the typical price calculation, but the standard (H+L+C)/3 works for most applications.
The Math Behind OBV
OBV's calculation is conceptually simple but accumulates meaningful information across many bars.
Start with OBV = 0 at the chart's first bar. For each subsequent bar: if the close is higher than the prior close, add that bar's volume to OBV. If the close is lower than the prior close, subtract that bar's volume from OBV. If the close equals the prior close, OBV remains unchanged.
Day 1: Close 100, Volume 10,000 (starting point, OBV = 0) Day 2: Close 102, Volume 15,000 (up day — OBV becomes 0 + 15,000 = 15,000) Day 3: Close 101, Volume 12,000 (down day — OBV becomes 15,000 − 12,000 = 3,000) Day 4: Close 103, Volume 20,000 (up day — OBV becomes 3,000 + 20,000 = 23,000) Day 5: Close 102, Volume 8,000 (down day — OBV becomes 23,000 − 8,000 = 15,000) The running total reflects the net direction of volume. OBV rising over time means more volume has been on up days than down days, indicating net buying pressure across the measured period. OBV falling means more volume on down days, indicating net selling pressure.
OBV's specific value at any moment is meaningless — what matters is the trend in OBV across time and how that trend compares to price. Rising OBV alongside rising price confirms the uptrend has volume support. Rising price with falling OBV warns that the rally lacks volume support and may not sustain. The relative direction of OBV versus price is the analytical signal, not OBV's absolute level.
The Math Behind VWAP
VWAP's calculation requires several pieces of data for each bar. For each bar in the session, calculate the typical price: (high + low + close) / 3. Multiply this typical price by the bar's volume to get the price-volume product. Sum the price-volume products from the session's start through the current bar. Sum the volumes from the session's start through the current bar. Divide the cumulative price-volume by cumulative volume:
VWAP Formula
VWAP = Σ(typical price × volume) / Σ(volume)
Three consecutive intraday bars at the start of a session: Bar 1: Typical price 100, Volume 5,000 → contribution 500,000 Bar 2: Typical price 102, Volume 8,000 → contribution 816,000 Bar 3: Typical price 101, Volume 6,000 → contribution 606,000 Cumulative price-volume: 500,000 + 816,000 + 606,000 = 1,922,000 Cumulative volume: 5,000 + 8,000 + 6,000 = 19,000 VWAP after Bar 3: 1,922,000 / 19,000 = 101.16 VWAP after Bar 3 reads 101.16 — the volume-weighted average price across all three bars. If most trading occurred at higher prices, VWAP would be higher; if most occurred at lower prices, lower. The weighting by volume means high-volume bars contribute more to VWAP than low-volume bars.
VWAP is the average price weighted by participation. Price above VWAP means current price is higher than the volume-weighted average for the session — buyers are paying more than the average participant. Price below VWAP means sellers are accepting less than the average participant. Institutional traders use VWAP as an execution benchmark; if they buy below VWAP and sell above VWAP, they've performed better than the volume-weighted average.
The Math Behind MFI
MFI's calculation extends the RSI framework to incorporate volume.
Step 1: Calculate typical price for each bar: (high + low + close) / 3. Step 2: Calculate raw money flow for each bar: typical price × volume. Step 3: For each bar in the lookback period (default 14), classify the money flow as positive or negative based on whether the typical price rose or fell from the prior bar. Step 4: Sum positive money flows and sum negative money flows across the lookback period. Step 5: Calculate the money ratio: positive money flow sum / negative money flow sum. Step 6: Calculate MFI:
MFI Formula
MFI = 100 − (100 / (1 + money ratio))
The final formula is identical to the RSI formula, but with the money ratio instead of the gain/loss ratio. This is why MFI is often called 'volume-weighted RSI.'
Over the last 14 bars, the sum of positive money flows is 3,000,000 and the sum of negative money flows is 1,000,000: Money ratio: 3,000,000 / 1,000,000 = 3 MFI: 100 − (100 / (1 + 3)) = 100 − 25 = 75 MFI reads 75 — approaching overbought (80) but not yet at the threshold. The reading is similar to what RSI would produce for similar price movement, but the volume weighting means high-volume bars in either direction have more influence than low-volume bars.
MFI carries similar information to RSI but with volume weighting. When recent gains have occurred on heavy volume while losses occurred on light volume, MFI runs higher than RSI would. When gains occurred on light volume while losses occurred on heavy volume, MFI runs lower than RSI. The volume weighting captures the conviction behind price movements that price-only oscillators miss.
Reading the Volume Tools in Context
Each tool has specific reading habits that make it useful within integrated analysis.
- Reading OBV. Watch the direction of OBV relative to price. Confirming OBV (rising during rising prices, falling during falling prices) supports the trend. Diverging OBV warns of potential reversal. Look specifically for the bullish divergence pattern (price makes lower low, OBV makes higher low) and bearish divergence (price makes higher high, OBV makes lower high). These divergences often precede reversals by weeks or months on weekly charts.
- Reading VWAP. During the trading day, VWAP acts as a dynamic reference level. Price above VWAP suggests bullish bias for the session; price below suggests bearish bias. Bullish day traders often look for pullbacks to VWAP as long entry opportunities; bearish day traders look for rallies to VWAP as short entry opportunities. The VWAP bands (1, 2, 3 standard deviations) provide additional reference levels similar to Bollinger Bands.
- Reading MFI. Apply the same reading habits as RSI from Lesson 34, but recognize that MFI's volume weighting makes its signals more meaningful when volume has been varying significantly across bars. In low-volume periods where all bars have similar volume, MFI and RSI produce similar signals. In high-variance volume periods, MFI signals carry more information than RSI alone.
- Combining the volume tools. Many traders use OBV for trend confirmation, VWAP for intraday reference levels, and MFI for divergence detection. The three tools answer different questions and don't substantially overlap, so using them together is less of an indicator soup problem than stacking multiple momentum oscillators.
Pattern Statistics and Sources
QuantifiedStrategies' backtest of OBV trading strategies on the S&P 500 showed 369 trades with an average gain per trade of 0.6%, a 75% win rate, maximum drawdown of 24%, and profit factor of 2.01. However, their research notes that volume as a standalone parameter has limited value — the strong win rate comes from specific OBV applications integrated with broader market context rather than from mechanical OBV signals.
ToSIndicators' research on volume indicators across 1,872 breakout events in 50 S&P 500 stocks from 2024-2026 found that relative volume readings of 1.5-2.0 produce the highest 3-day follow-through rates at 58.8%. This confirms that volume confirmation substantially improves breakout reliability, with optimal volume expansion (not too low, not extremely high) producing the best follow-through results.
Liberated Stock Trader's research on OBV finds that to improve OBV signal reliability, traders should pair it with RSI or MACD. OBV divergence — when price and OBV move in opposite directions — is described as the most useful OBV pattern, with bullish divergence (price drops but OBV rises) suggesting increasing buying pressure that could lead to upward price movement.
The pattern matches what we've seen with every other indicator: standalone use produces mediocre results; integrated use produces substantially better results. OBV's main value comes from divergence detection rather than direct signal generation. VWAP's main value comes as a dynamic reference level for intraday traders. MFI's main value is essentially RSI's value with the volume weighting making certain signals more reliable.
- Joseph Granville's original publications on OBV from the 1960s
- liberatedstocktrader.com — research on OBV and volume indicators
- quantifiedstrategies.com — backtested OBV strategies on multiple asset classes
- tosindicators.com — thinkorswim-specific research on volume tools
- Anna Coulling's 'A Complete Guide to Volume Price Analysis' — practical volume analysis methodology
- Academic literature via Google Scholar — search 'volume analysis,' 'On-Balance Volume,' 'VWAP execution'
Common Student Mistakes with Volume Tools
- Treating OBV's absolute value as meaningful. OBV's specific number is arbitrary — it depends entirely on when the chart's history started. What matters is the direction of OBV across time and how that direction compares to price. Beginners sometimes try to interpret OBV's level (high OBV is bullish, low OBV is bearish) which is meaningless.
- Using VWAP on the wrong timeframe. VWAP resets at the start of each trading session, which makes it primarily a day trading tool. Using session VWAP on a weekly or monthly chart doesn't produce meaningful signals because the VWAP keeps resetting too frequently relative to the timeframe being analyzed. Anchored VWAP solves this by allowing the trader to choose meaningful anchor points.
- Treating MFI as identical to RSI. The volume weighting makes MFI's signals different from RSI's in specific situations. Strong moves on heavy volume push MFI more decisively than RSI; the same moves on light volume push MFI less. Traders who treat them as interchangeable miss the specific information MFI's volume weighting provides.
- Ignoring volume divergence entirely. OBV divergence is one of the most valuable signals the indicator provides. Many traders watch OBV's general direction without specifically looking for divergence patterns, missing the most useful signals.
- Adding all volume indicators to the same chart. OBV, VWAP, MFI, Chaikin Money Flow, Accumulation/Distribution, Volume Profile, and others can all be added simultaneously. They mostly measure similar things and stacking them produces indicator soup. Pick one or two that fit your specific use case.
- Trying to use VWAP as a standalone signal. Like all indicators, VWAP works better as part of integrated analysis than as a standalone trigger. 'Buy when price crosses above VWAP, sell when it crosses below' produces mediocre results when applied mechanically.
Reading Volume Tools Integrated with Prior Lessons
The integrated chart below follows the progressive integration principle. It includes candle patterns from Lessons 1-13, a chart pattern from Lessons 14-28, moving averages from Lesson 30, and the new OBV tool from this lesson — showing how volume analysis adds an additional dimension to the integrated reading.
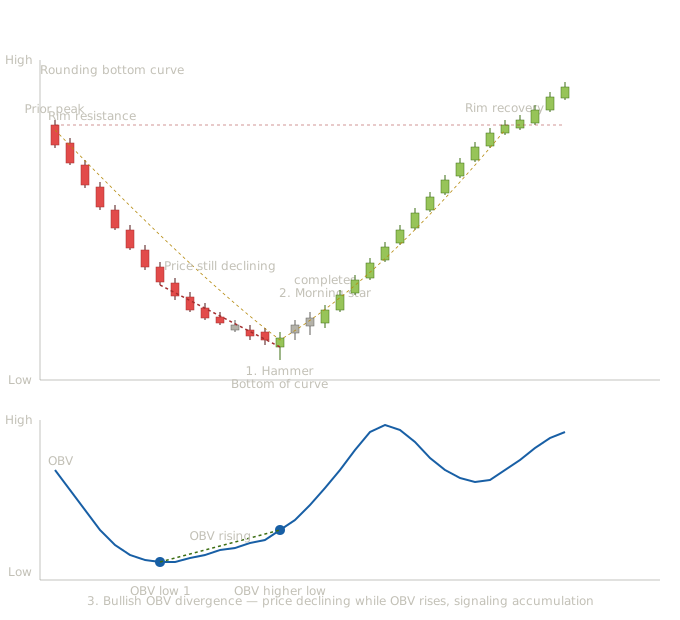
Rounding bottom (Lesson 18) with hammer and morning star at the structural low, and OBV showing bullish divergence well before price confirms the reversal
This chart shows what the integrated reading looks like with OBV added below the price chart. The chart includes a rounding bottom pattern from Lesson 18, two named candle patterns from Lessons 1-13 (hammer and morning star), and OBV showing a clear bullish divergence well before price confirms the reversal.
The early decline (candles 1-12). Twelve bearish candles drive price down with steady directional pressure. OBV declines alongside price during this phase, confirming the downtrend — selling volume exceeds buying volume.
The decline slows (candles 13-18). Six more bearish candles continue the decline but with smaller bodies and less aggressive selling. The pace of OBV's decline slows even as price continues making new lows. This is the early development of the bullish divergence — selling volume is fading even as price extends downward.
A hammer forms at what becomes the rounding bottom's structural low. From Lesson 3, this is the canonical bullish reversal candle. From Lesson 18, this marks the lowest point of the rounding bottom pattern. The OBV at this moment is already higher than its low several bars earlier — bullish divergence is established.
The morning star development (candles 20-22). A three-candle morning star pattern completes. Bearish candle, then small-body indecision (candles 20 and 21), then strong bullish candle (candle 22). From Lesson 7, the morning star is one of the most reliable bullish reversal patterns. The OBV continues rising during this period, confirming that buying volume is increasing as price establishes the bottom.
Looking at the OBV chart, the OBV low at candle 8 reads lower than the OBV low at candle 19 (where the hammer formed). But price made a lower low at candle 19 than at candle 8. Price made a lower low; OBV made a higher low. This is bullish divergence — the volume dynamics signal accumulation even as price continues lower.
The divergence developed gradually over many bars before any clear price reversal. A trader watching OBV would have early warning that the decline was structurally exhausting — buyers were quietly accumulating even while price kept making new lows. This is exactly the kind of advance signal that volume analysis provides that price-only analysis misses.
The recovery and breakout (candles 23-34). Twelve bullish candles drive price up through the right side of the rounding bottom, eventually approaching the rim resistance level. OBV continues rising throughout, confirming that volume supports the new uptrend. The combination of rounding bottom completion, named candle patterns at the structural low, and OBV bullish divergence provides multi-dimensional confirmation of the reversal.
What this integrated chart teaches together. Several pedagogical points emerge.
OBV divergence often precedes price reversals by many bars. The OBV started showing higher lows while price was still making lower lows. A trader watching only price would have seen continued bearish action; a trader watching OBV would have known buyers were quietly accumulating. The advance warning value of OBV divergence is what makes the indicator most useful.
Volume confirmation strengthens chart pattern reliability. The rounding bottom pattern alone would be a tradeable setup. The rounding bottom with OBV bullish divergence is a higher-conviction setup because two independent analytical dimensions agree.
Candle reversal patterns at structural moments combined with volume divergence create the highest-conviction signals. The hammer at the rounding bottom's structural low, occurring with OBV already showing bullish divergence, creates multi-layer confluence that warrants meaningful position sizing.
Integration with Prior Lessons
The volume tools integrate with everything the curriculum has built. Volume confirmation improves chart pattern reliability (Lessons 14-28 reference volume signatures repeatedly). Volume expansion on breakouts adds conviction to entries. Volume divergence on OBV or MFI warns of trend exhaustion that other indicators may miss. VWAP provides intraday support and resistance levels that interact with candle patterns and chart pattern structures.
How This Lesson Connects to What Comes Next
Lesson 38 covers ADX (Average Directional Index) and Parabolic SAR — two tools specifically designed to measure trend strength and identify trend changes. With momentum and volume tools now covered, the trend strength tools complete the major analytical categories beyond moving averages. ADX in particular is widely used as a regime filter — distinguishing trending markets (where momentum and crossover signals work well) from ranging markets (where mean reversion signals work better).
Key Takeaways
- OBV is a cumulative indicator: up-day volume is added, down-day volume is subtracted — the trend in OBV relative to price reveals accumulation (buyers positioning before moves) or distribution (sellers exiting before declines)
- OBV's absolute value is meaningless — only the direction of OBV relative to price matters; OBV divergence (price makes new extreme, OBV does not) is its most valuable signal
- VWAP weights each price by volume transacted at that price, making it the execution benchmark institutional traders use — price above VWAP is bullish session bias, below is bearish
- VWAP resets at each session start, making it primarily a day trading tool; anchored VWAP extends its usefulness by starting from a trader-chosen structural anchor point
- MFI is RSI with volume weighting — strong price moves on heavy volume push MFI more than RSI, while light-volume moves push it less; the difference captures conviction behind price action
- OBV, VWAP, and MFI answer different questions and combining two is less of an indicator soup problem than stacking multiple momentum oscillators — but all three together is usually excessive
Quiz — 3 Questions
Answer one at a timeA stock's price makes four consecutive lower lows over six weeks. During the same period, OBV rises steadily. The price is declining but OBV is rising. What is this pattern and what does it signal?
In this lesson
400 — Technical Indicators — Integration and Methodology