Cup and Handle — and Inverse Cup and Handle
The cup and handle is the most famous chart pattern in modern technical analysis, popularized by William O'Neil in his work on growth stock trading and codified in his CAN SLIM methodology. The pattern combines a rounded "cup" formation with a small "handle" consolidation, producing a bullish continuation setup with clear structural rules and a measurable target. The inverse pattern provides the bearish mirror, less commonly traded but structurally identical in reverse.
Cup and Handle — and Inverse Cup and Handle
The cup and handle is the most famous chart pattern in modern technical analysis, popularized by William O'Neil in his work on growth stock trading and codified in his CAN SLIM methodology. The pattern combines a rounded "cup" formation with a small "handle" consolidation, producing a bullish continuation setup with clear structural rules and a measurable target. The inverse pattern provides the bearish mirror, less commonly traded but structurally identical in reverse.
This lesson teaches the cup and handle as a hybrid pattern that combines elements from earlier lessons. Students who've worked through Lesson 18's rounding patterns recognize the cup as a rounding bottom variant. Students who've worked through Lesson 20's flags recognize the handle as a small flag-like consolidation. The cup and handle integrates both into a single setup with stronger reliability than either component alone.
Vocabulary
| Term | Definition |
|---|---|
| Cup and handle | A bullish continuation pattern consisting of two structural components: a rounded "cup" formed through a gradual decline and recovery, followed by a smaller "handle" formed through a brief pullback before the breakout. The pattern resolves when price breaks above the cup's right rim and the handle's resistance, resuming the prior uptrend or initiating a new advance. |
| Cup | The first component, traced by price declining from a prior high, finding support at the cup's bottom, and recovering back to approximately the same level as the prior high. The decline-and-recovery shape resembles a teacup or saucer when viewed across the formation. Cups typically take weeks to months to form on daily charts. |
| Handle | The second component, a small pullback that forms after price recovers to the cup's right rim. The handle is typically smaller than the cup in both depth and duration — often described as forming in the upper third of the cup's range. The handle's structure resembles a small flag or pennant, with its own trendline that becomes the breakout trigger. |
| Cup rim | The price level at the top of the cup, where the cup's initial decline began and where the right side of the cup recovers to. This level becomes resistance during the cup's formation and the breakout threshold when the pattern completes. |
| Cup depth | The vertical distance from the cup's rim to the cup's lowest point. The depth determines the measured-move target after breakout and also affects pattern reliability — cups that are too shallow may not represent meaningful consolidation, while cups that are too deep often signal damage to the underlying trend. |
| Handle depth | The vertical distance the handle retraces from the cup's right rim. Healthy handles retrace less than one-third of the cup's depth; handles retracing more than 50% of the cup are generally regarded as too deep and reduce the pattern's reliability significantly. |
| Cup duration | The time the cup takes to form. O'Neil's original CAN SLIM criteria specified at least 7 weeks on daily charts, with the most reliable cups forming over 3-6 months. Cups shorter than 7 weeks often lack the base-building that gives the pattern its strength. |
| Handle duration | The time the handle takes to form. Healthy handles typically resolve within 1-4 weeks on daily charts. Handles taking longer than this often evolve into deeper consolidations that lose the pattern's character. |
| Inverse cup and handle | The bearish mirror pattern. An inverted bowl shape (the inverse cup) followed by a small rally (the inverted handle) before breakdown. The pattern resolves when price breaks below the inverse cup's right rim and the handle's support level. |
| Cup symmetry | A measure of how similar the cup's left side decline is to its right side recovery in depth, duration, and candle character. Symmetric cups are generally regarded as more reliable than asymmetric ones because the symmetry confirms the bottom is structural rather than coincidental. |
Anatomy of the cup and handle with candle integration
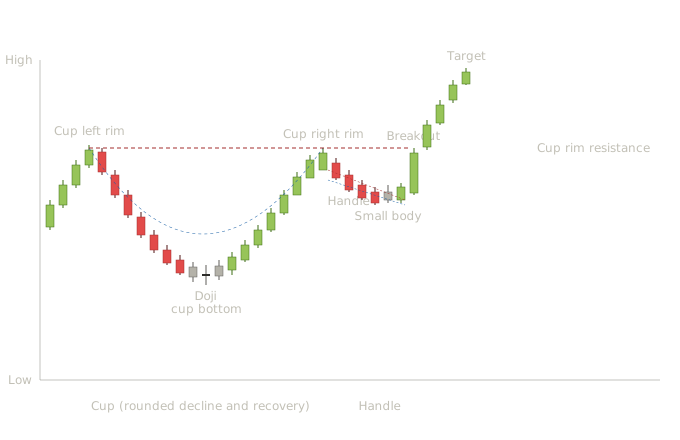
The cup and handle requires reading both components separately before integrating them. Students who recognize the cup as a rounding bottom (Lesson 18) and the handle as a small flag (Lesson 20) have most of the analytical tools they need — what this lesson adds is the integrated reading of how the two components work together. The cup's left rim rise (candles 1-4). Four bullish candles drive price up toward what becomes the cup's left rim. These candles establish the level that gives the cup its structural identity. Without the prior rise reaching a meaningful high, the eventual U-shape wouldn't be a cup — it would just be a sideways consolidation in random price action. The cup's gradual decline (candles 5-11). Seven bearish candles drive price down through the cup's left side. From the candle-body trajectory reading habit, notice that the bodies start at moderate size and gradually shrink as the decline progresses. This is fading selling pressure rather than accelerating panic — the gentle decline signals that the eventual bottom will form through rounding rather than capitulation. This is one of the key reading habits that distinguishes a cup from a V-bottom. V-bottoms show accelerating bearish bodies into a violent capitulation. Cups show decelerating bearish bodies into gradual exhaustion. Both produce bottoms, but the candle character tells students which pattern they're watching form. The cup's floor with doji and small bodies (candles 12-14). Three small candles appear at the bottom of the cup, including a doji at the center. From Lesson 18's reading of rounding bottoms, this is the canonical signature of a rounding floor — indecision candles marking the gradual transition from selling pressure to neutral to buying pressure. The doji at the cup's bottom is doing what a hammer does in a sharper reversal: marking the end of the decline. But it does so quietly through equilibrium rather than dramatically through reversal candles. The cup's gradual recovery (candles 15-21). Seven bullish candles drive price back up to approximately the cup's left rim level. The bodies grow progressively larger as the recovery gains conviction — mirror image of the gentle decline. This symmetry across the cup's midpoint is what gives the pattern its rounded shape. The candle-body symmetry is something students should check explicitly. A proper cup shows the decline-and-recovery as gradual processes with candle bodies that grow and shrink symmetrically across the formation. A cup with violent decline followed by violent recovery isn't really a cup — it's more like a V-bottom that happened to recover to the same level. Cup right rim reached (candle 21). Price arrives back at the prior rim level. The cup component is now complete. At this point students see a rounding bottom that recovered to the prior high. Without the handle that follows, this would just be a recovery that may or may not break through the resistance level above. The handle's pullback (candles 22-25). Four small bearish candles produce a shallow pullback from the right rim. The handle's depth is much less than the cup's depth — in this illustration the handle retraces roughly one-quarter of the cup's depth, well within the healthy range. The bodies are small, the decline is contained, and the overall structure resembles a small flag from Lesson 20. The candle character within the handle matters as much as the structural depth. Healthy handles show small bodies and orderly decline — they're brief consolidations, not aggressive declines. A handle showing large bearish bodies signals real selling pressure rather than profit-taking, and patterns with that handle character often fail at the eventual breakout attempt. Small body in the handle (candle 26). A tiny-bodied indecision candle near the handle's low signals the pullback is exhausting. From the candle-pattern reading habits, this is similar to the equilibrium candles that appear before flag breakouts in Lesson 20 — the handle is preparing to resolve. The handle's brief recovery (candle 27). A small bullish candle begins the move back toward the rim. The handle's resistance is the highest point reached during the handle, which is generally near the cup's right rim level. The breakout candle (candle 28). A long bullish near-marubozu breaks decisively above both the handle's resistance and the cup's rim level. The body is dramatically larger than the handle's compressed candles, the close is well above both breakout levels, and the candle structure shows minimal upper shadow. From Lesson 2, this is the high-quality breakout candle that confirms the cup and handle pattern's resolution. Breakout candle quality matters significantly for cup and handle reliability. A weak breakout barely clearing the resistance level often becomes a false breakout. A strong breakout candle with decisive structure rarely fails to follow through. Continuation toward target (candles 29-32). Four more bullish candles drive price toward the measured-move target. The classical measured move is calculated as the depth of the cup (from the rim to the cup's lowest point) projected upward from the breakout point.
The cup and handle teaches integrated reading across multiple pattern types students have already learned: The cup is a rounding bottom. The body-shrinkage during the decline, the doji at the floor, the body-growth during the recovery — all map directly to Lesson 18's rounding bottom reading habits. Students don't need new analytical tools to read the cup itself; they apply what they already know about gradual reversals. The handle is a small flag. The brief duration, the shallow counter-trend slope, the small bodies, the small-body equilibrium candle before the breakout — all map directly to Lesson 20's flag reading habits. Students don't need new tools for the handle either. The integration is what makes the pattern strong. A rounding bottom alone is reliable but the recovery often stalls at prior resistance because there's no specific trigger for breakout — price just hovers near the rim level until something happens. A flag alone is reliable but only after a strong pole that the trader needs to identify and trust. The cup and handle combines both: the cup provides the structural setup that establishes a clear breakout level, and the handle provides the tight consolidation that gives traders a precise entry trigger. This is why O'Neil's CAN SLIM methodology emphasizes the cup and handle as a high-probability setup. The pattern offers something rare in technical analysis: a clear entry trigger at a structurally significant level, with the prior pattern formation providing both the reason to expect continuation and the reason to expect the specific breakout level to matter.
The cup and handle has a characteristic volume profile that students should learn to read alongside the price structure: Volume should decline progressively during the cup's left-side decline. Fading participation as price retreats from the prior high. Buyers who hadn't been involved aren't yet interested; sellers are gradually exhausting their inventory. Volume should reach its lowest point at the cup's bottom. Minimal interest at the indecision zone where the doji and small-body candles form. The market has largely lost interest in the instrument at these levels. Volume should expand progressively during the cup's right-side recovery. Building participation as buyers return. Each successive session brings more participants, mirroring the candle-body growth that signals returning conviction. Volume should contract again during the handle's pullback. Minimal interest during the tight consolidation. The pullback isn't a serious decline; it's profit-taking from short-term traders combined with minor distribution as some weak-handed holders take their gains. Volume should surge dramatically at the breakout. New participation joining the resolution. The volume spike at breakout is one of the most important confirmation signals — patterns breaking out on low volume are notably less reliable than patterns breaking out on heavy volume. The U-shape-followed-by-spike volume pattern is one of the more distinctive volume signatures in chart pattern analysis. Cup and handle patterns with this volume signature are far more reliable than patterns with erratic volume throughout.
Anatomy of the inverse cup and handle
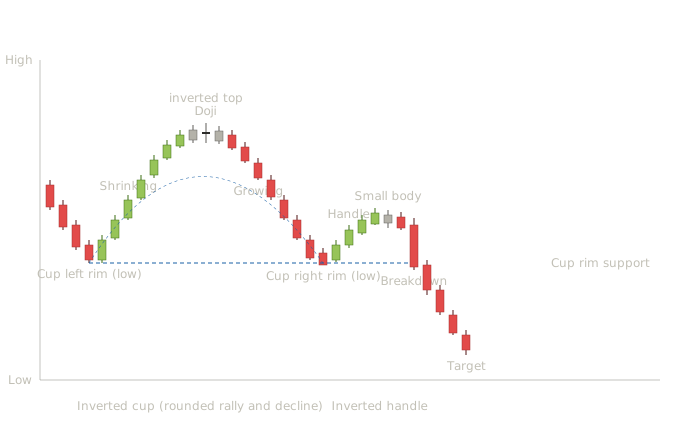
The inverse pattern mirrors everything about the bullish cup and handle in reverse. The structural narrative tells the same story inverted: gradual exhaustion of buying pressure (the inverted cup's rise), indecision at the top (the doji at the inverted top), gradual building of selling pressure (the inverted cup's decline), brief upward pause (the inverted handle), then decisive breakdown. The inverted cup's left rim formation (candles 1-4). Four bearish candles drive price down to the level that establishes the cup's structural identity. This is the low that the inverted cup will rise from and eventually return to. The inverted cup's gradual rise (candles 5-11). Seven bullish candles drive price up with progressively shrinking bodies. The body-shrinkage signals fading buying pressure — exactly the same reading habit from Lesson 18's rounding tops, just applied to the cup variant. Buyers are still in control of each session, but their conviction is decreasing. The doji at the inverted top (candles 12-14). Three small candles including a centered doji mark the inverted cup's high. The indecision at the top has the same structural significance as the doji at a bullish cup's bottom — gradual transition from one regime to another, marked by equilibrium rather than dramatic reversal. The inverted cup's gradual decline (candles 15-21). Seven bearish candles drive price back down to approximately the cup's left rim level. The bodies grow progressively larger as the decline gains conviction — mirror image of the gradual rise. The inverted handle's upward pullback (candles 22-26). Five candles produce a small upward-sloping consolidation as price briefly retraces upward before resuming the decline. The handle's depth is much less than the cup's depth, the bodies are small, and the structure resembles a small bear flag. The small-body equilibrium candle (candle 26). Indecision near the handle's high signals the brief recovery is exhausting. The breakdown candle (candle 28). A long bearish near-marubozu breaks decisively below both the handle's support and the cup's rim level. The body is dramatically larger than the handle's compressed candles. This is the high-quality breakdown candle that confirms the inverse cup and handle's resolution. Continuation toward target (candles 29-32). Four more bearish candles drive price toward the measured-move target — the depth of the inverted cup projected downward from the breakdown point.
Pattern statistics and sources
Cup and handle
| Attribute | Notes |
|---|---|
| Confirmation rule | Decisive close above the handle's resistance and the cup's right rim, ideally with volume expansion of at least 1.5x the recent average. Conservative entry waits for retest of the broken rim level from above; aggressive entry takes the breakout candle close. |
| Volume signature | The distinctive U-shaped volume profile across the cup, low volume during the handle's consolidation, and a clear volume spike at the breakout. Volume confirmation is one of the most important reliability factors for this pattern. |
| Reliability | Highly variable across sources, with the variability driven primarily by how strictly the pattern is defined and how "success" is measured. |
| Common failure mode | Handle retracement exceeds 50% of the cup's depth, signaling the consolidation is too deep to be a healthy pause. False breakout that fails to follow through. |
Cited statistics — note the dramatic spread:
Liberated Stock Trader cites twenty years of trading research showing the cup and handle pattern has a 95% success rate in bull markets with an average profit of +54%. With 61% of trades reaching the average price target, they describe it as the most reliable pattern in technical analysis.
InvestingGoal cites Bulkowski's research from The Encyclopedia of Chart Patterns reporting a 65-70% success rate with an average rise of 24% after breaking out past the resistance level. Bulkowski's accuracy figure for the cup and handle in bull markets is 68% based on analysis of 1,044 patterns.
Bapital's algorithmic backtesting of 3,125 cup and handle formations found an accuracy rate of 49% with an average return-to-risk ratio of 2.5 to 1. The pattern's highest win rate occurs on weekly timeframe charts at 54%, while the lowest is on 1-second charts at 43%. The pattern is most reliable in bullish trending markets and least reliable in choppy sideways conditions.
LuxAlgo's research shows cup and handle success rates improving over time — 70% over 1 year, 80% over 5 years, and 85% over 10 years. Ideal measurements include cup depth at 38.2-61.8% of the prior trend and handle slope at 10-15%. Volume should be at least 40% above the 20-period average on breakout day.
TradingSim reports historical cup and handle success rates of 65-80% when properly identified with volume confirmation and correct risk management. Personal trading experience shows 72-76% win rates when following strict rules (minimum 15% cup depth, handle retracement under 25%, volume spike on breakout, 1.5:1+ risk-to-reward). Without these rules, success rates drop to 50-55%. Backtests across US equities suggest 60-65% win rates when the pattern meets all CAN SLIM criteria.
QuantifiedStrategies' review of Bulkowski's manual backtest found a failure rate of 26% — above the 20% threshold Bulkowski considers acceptable. When restricted to patterns confirmed by upside breakout, the failure rate drops to 10%.
Inverse cup and handle
| Attribute | Notes |
|---|---|
| Confirmation rule | Decisive close below the handle's support and the inverted cup's right rim level. |
| Volume signature | Mirror of the bullish pattern — declining volume during the inverted cup's rise, low volume during the handle, expanding volume on breakdown. |
| Reliability | Generally regarded as a respected bearish continuation pattern. |
Cited statistics for inverse cup and handle:
Bullish cup and handle research dramatically outweighs research on the inverse pattern. Most sources cover the bullish version extensively while treating the inverse as a footnote. Students researching the inverse pattern should expect smaller sample sizes and more limited statistical confidence in published figures.
What the dramatic spread teaches
Cup and handle reliability ranges from 49% (Bapital's algorithmic backtest of 3,125 patterns) to 95% (the famous figure from extensive Bulkowski-derived research). This is one of the widest spreads in our entire curriculum, and the methodological reasons matter significantly for your students.
**Break-even versus measured-move definitions of success.** The widely-quoted 95% figure measures whether patterns move at least 5% past the breakout level. By that loose standard, patterns in trending markets almost always look successful. The same patterns reaching their full measured-move target produces a 61% success rate — still respectable, but dramatically different. Students who hear "95% reliable" need to understand they're not hearing "95% reach the target." **Manual versus algorithmic detection.** Bulkowski's data uses manual identification where human judgment can favor "clean" examples. Bapital's data uses algorithmic detection applied uniformly to all qualifying patterns. The gap between the two — about 46 percentage points — is among the largest methodological gaps we've seen across any pattern in this curriculum. The same structural shape produces 49% reliability when identified by algorithm and 95% reliability when identified by experienced human eye, partly because the human eye filters out patterns that don't quite work before counting them. **Definition strictness drives results.** TradingSim's data showing 72-76% reliability with strict rules versus 50-55% without those rules illustrates how pattern definition strictness affects outcomes. A "cup and handle" can be identified loosely or strictly, and the loosely-identified patterns perform much worse than the strictly-identified ones. For your students, the practical takeaway: the cup and handle is a real pattern with a real edge, but the specific edge depends enormously on how strict the identification criteria are. A trader who identifies cup and handles loosely will get average results around 50%. A trader who waits for textbook patterns with proper volume signature, appropriate cup depth, shallow handles, and decisive breakouts will get dramatically better results. Quality of identification is the most important variable for this pattern. This is a particularly important methodological lesson because the cup and handle is the most-promoted pattern in retail trading education. Students will see the "95% reliable" figure repeatedly. Understanding what that figure actually measures, and how dramatically results vary with identification strictness, prepares students to evaluate the pattern realistically rather than chasing a misleading promise.
Multi-source pool
For students who want to dig deeper into cup and handle statistics:
- William O'Neil's How to Make Money in Stocks — the foundational work where the cup and handle pattern was first systematically described as part of the CAN SLIM methodology. Worth reading in full for students who want to trade this pattern seriously.
- thepatternsite.com (Bulkowski) — extensive research on cup and handle variants with reliability rankings.
- liberatedstocktrader.com — multiple articles on cup and handle with explicit success-rate figures.
- bapital.com — algorithmic backtesting with the largest sample size we've seen for this pattern (3,125 formations).
- luxalgo.com — research aggregation with timeframe-specific reliability figures.
- tradingsim.com — practical trading rules with backtested reliability under different identification criteria.
- quantifiedstrategies.com — methodological commentary on Bulkowski's findings.
- chartscout.io — important methodological clarification on what the "95% success rate" actually measures.
- Academic literature via Google Scholar — search "cup and handle technical analysis" or "CAN SLIM methodology."
Common student mistakes with the cup and handle
Real cups have specific structural requirements — gradual decline and recovery with body-trajectory symmetry, appropriate depth (typically 12-33% of the prior trend in O'Neil's framework), and an extended formation period (at least 7 weeks per O'Neil's original CAN SLIM criteria on daily charts). Random U-shaped price action without these characteristics isn't really a cup.
Cups that retrace less than 12% of the prior trend often haven't represented meaningful consolidation. There hasn't been enough price action to flush out weak holders and bring in new buyers, so the eventual breakout often lacks support.
Cups retracing more than 50% of the prior trend's gains tend to fail more often than shallower cups. Students who accept very deep cups as valid setups are essentially trading patterns where significant damage has already occurred to the prior uptrend. O'Neil himself recommended avoiding cups deeper than 33% in most cases.
The handle should retrace less than one-third of the cup's depth. Handles that retrace 50% or more of the cup are too deep to be true handles — they signal that the rally that should have followed the cup didn't have sufficient buying support.
A cup requires gradual decline and recovery with the rounding shape produced by body-trajectory symmetry. A V-shaped recovery from a sharp decline isn't a cup — it's a V-bottom from Lesson 18 that happened to recover to the same level. Students should distinguish between the two because they have different reliability characteristics and different reading habits.
The breakout from a cup and handle should be decisive with a long bullish body and volume of at least 1.5x recent average. Weak breakouts with small bodies and average volume often become false breakouts. The candle-level reading from Lesson 2 directly applies to evaluating breakout quality.
Cups form best in markets that are still in overall uptrends. Cups appearing in sideways or choppy markets often fail because the underlying conditions don't support the trend continuation that the pattern presumes. The 200-day moving average is one useful filter — patterns appearing above a rising 200-day MA tend to outperform patterns appearing below a declining 200-day MA significantly.
The U-shaped volume profile and the breakout volume spike are among the most important confirmation factors for this pattern. Students who only look at price structure miss the significant reliability difference between patterns with and without proper volume signature.
How this lesson connects to what comes next
The cup and handle completes the major Western pattern vocabulary that most students will use in practice. The remaining lessons in the curriculum are now structural rather than additive:
Lesson 23 builds the chart pattern interpretation framework — the parallel to Lesson 12 for candles. The framework formalizes the dimensions students have been applying throughout the chart pattern section: location quality, structural magnitude, volume confirmation, measured-move targets, failure modes, multi-timeframe context, and confluence with candle-level signals.
Lesson 24 is the synthesis lesson where candle and chart analysis come together formally. The integrated reading we've been building throughout the curriculum gets laid out as a complete methodology students can apply systematically to any chart they look at.
Quiz — 3 Questions
Answer one at a timeThe lesson describes a widely-cited '95% success rate' figure for the cup and handle pattern. What does the lesson say this figure actually measures, and how does that differ from what students typically assume it means?
In this lesson
300 — Western Chart Patterns — Structure, Candle Integration, Statistics