Triangles: Symmetrical, Ascending, and Descending
Triangles are the most common continuation patterns in technical analysis. They form when price oscillates within converging boundaries, with each oscillation smaller than the previous one.
Triangles: Symmetrical, Ascending, and Descending
Triangles are the most common continuation patterns in technical analysis. They form when price oscillates within converging boundaries, with each oscillation smaller than the previous one. The converging boundaries trace out a triangle shape, and the eventual breakout from the triangle typically resumes whatever trend preceded the formation.
Triangles are pedagogically important because they teach students a different reading habit from reversal patterns. Reversal patterns are about identifying when a trend is ending; triangle patterns are about identifying when a trend is pausing. Students who only know reversal patterns misread triangles as topping or bottoming formations and miss the continuation that follows. The structural rules and candle-level signals within triangles tell students which interpretation is correct.
Vocabulary
| Term | Definition |
|---|---|
| Symmetrical triangle | A continuation pattern bounded by a descending upper trendline (connecting lower highs) and an ascending lower trendline (connecting higher lows). Both trendlines slope toward each other at roughly similar angles, converging at an apex. The pattern represents a balanced compression of price action — buyers and sellers fighting in a progressively narrowing range until one side overwhelms the other at the breakout. |
| Ascending triangle | A continuation pattern with a horizontal upper trendline (connecting roughly equal highs) and an ascending lower trendline (connecting higher lows). The horizontal upper boundary acts as resistance that's being tested repeatedly, while the rising lower boundary shows buyers stepping in earlier on each pullback. Generally regarded as bullish — the ascending lower boundary suggests buying pressure is winning the compression. |
| Descending triangle | The bearish mirror. Horizontal lower trendline (connecting roughly equal lows) and a descending upper trendline (connecting lower highs). The horizontal lower boundary acts as support that's being tested repeatedly, while the falling upper boundary shows sellers stepping in earlier on each rally. Generally regarded as bearish — the descending upper boundary suggests selling pressure is winning the compression. |
| Apex | The point where the two converging trendlines would meet if extended. The pattern typically resolves through breakout before reaching the apex; the textbook guidance is that the breakout should occur somewhere between the halfway point and the three-quarters point of the distance from the pattern's start to its apex. |
| Touch | A point where price reaches one of the trendlines and reverses without breaking it. Each touch confirms that market participants are watching the level. The minimum for identifying a triangle is typically two touches on each trendline, with three or more touches strengthening the pattern's significance. |
| Apex breakout vs. mid-pattern breakout | A breakout occurring near the apex (where the trendlines have nearly converged) is generally regarded as less reliable than a breakout occurring earlier in the pattern's development. Late breakouts often lack the volume support and momentum to follow through. |
| Volume contraction during formation | The classical volume signature for triangles. Volume should decline progressively as the pattern develops, reflecting decreasing participation as the range narrows. Sharp volume expansion at breakout confirms the pattern. |
| False breakout | A breakout that crosses a trendline briefly and then returns into the triangle. Triangles are particularly prone to false breakouts because the converging structure attracts traders watching the boundaries closely, and brief excursions through the lines often trap them before reversing. |
| Continuation versus reversal | Triangles are generally regarded as continuation patterns, meaning the breakout typically resumes the prior trend. However, the resolution direction isn't guaranteed by the pattern's name; the breakout direction is what tells you the resolution. Students should not assume direction based on pattern type alone. |
Anatomy of a Symmetrical Triangle with Candle Integration
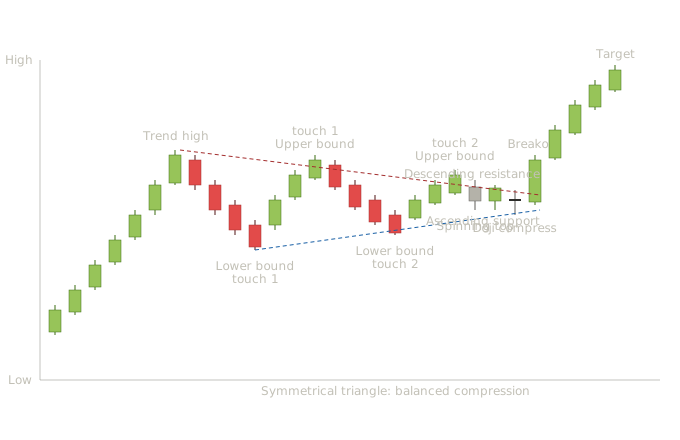
This chart shows the canonical symmetrical triangle pattern in action. An uptrend establishes itself, then enters a period of balanced compression where buyers and sellers fight to progressively narrower extremes, and finally the trend resumes through a decisive breakout. The candle-level signals within the formation tell students how to read each phase. The uptrend leading in (candles 1-7). Seven bullish candles drive price up with consistent moderate bodies. This is the prevailing trend the triangle will eventually continue. Without this prior uptrend, the formation that follows wouldn't be a continuation pattern — it would just be price oscillating in a narrowing range with no directional bias. The first decline from the trend high (candles 8-11). Four bearish candles drive price down from the peak. These are normal pullback candles — moderate bodies, orderly progression, no signs of capitulation. The pullback's depth establishes one anchor point for the eventual lower trendline. Lower bound touch 1 (candle 11). Price reaches what will become the ascending lower trendline and reverses. At this point, we don't yet have a triangle — we just have a pullback that ended. The student watching this in real time sees only "uptrend pulled back; might continue or might reverse." Pattern identification requires several more swings. The rally to upper bound touch 1 (candles 12-14). Three bullish candles drive price up but fail to reach the prior trend high. This failure to make a new high is the first hint that something different is happening — buyers tried but couldn't push back to the prior peak. The peak of this rally establishes the upper trendline's first anchor. The second decline (candles 15-18). Bearish candles drive price back down, but notice this decline doesn't reach as deep as the first decline. The bottom of this decline is higher than the first lower-bound touch. This is the second structural shift: each pullback is finding support earlier than the previous one. Buyers are stepping in at progressively higher levels. Lower bound touch 2 (candle 18). Price reaches the ascending lower trendline at a higher level than touch 1 and reverses. Now we have two touches on the lower trendline, both at progressively higher levels — the trendline becomes valid. Combined with the prior failed rally that established the upper trendline, the triangle structure is now identifiable. The rally to upper bound touch 2 (candles 19-21). Bullish candles drive price up but again fail to reach the prior peak — and they fail at a lower level than the prior rally. The upper trendline now has its second touch, also at a lower level than touch 1. The two trendlines are converging. The spinning top within the compression (candle 22). A small candle with shadows extending in both directions appears as price oscillates within the narrowing range. From Lesson 4, this is the spinning top — indecision with both sides fighting during the session. Inside a forming triangle, spinning tops are normal and expected; they reflect the compressed structure itself. Students should not treat them as reversal signals within this context. Doji compression (candle 24). As the trendlines converge, a doji appears. From Lesson 2, this is maximum indecision — open and close at essentially the same price. Inside a triangle, dojis near the apex often signal that the compression is reaching its breaking point. The market can't stay in indecision indefinitely; eventually one side will overwhelm the other. The doji is a key piece of the candle-level reading. Students should specifically watch for dojis or small indecision candles as the triangle approaches its apex — these are often the last sessions before the breakout. The compression that produces dojis is the same compression that produces the breakout when one side finally wins. The breakout candle (candle 25). A long bullish candle breaks decisively above the descending upper trendline. The body is large relative to the recent compressed candles, the close is well above the prior trendline level, and the candle structure is near-marubozu — minimal upper shadow, body spanning a large range. From Lesson 2, this is one-sided buyer control during the breakout session. The breakout candle is critical. A weak breakout candle — small body, long shadows, close near the trendline — is suspect and prone to becoming a false breakout. A strong breakout candle — large body, minimal counter-trend shadow, close well beyond the trendline — is much more likely to follow through. Students should always evaluate breakout candle quality before treating a triangle resolution as confirmed. The continuation toward target (candles 26-29). Four more bullish candles drive price higher toward the measured-move target. The measured move for a triangle is calculated by taking the height of the triangle at its widest point (the start of the formation) and projecting that distance from the breakout point in the breakout direction.
The triangle teaches a fundamentally different reading habit from reversal patterns:
**Multiple small candles within the structure are normal.** Reversal patterns are often marked by specific signal candles at specific moments — a hammer at a trough, a bearish engulfing at a peak. Triangles are different. The formation period itself is dominated by small, indecisive candles — spinning tops, dojis, short-bodied candles of either color. Students who interpret each of these as a reversal signal will get whipsawed constantly. Inside a triangle, indecision is the canvas, not the signal. **The breakout candle is the signal that matters.** Until price breaks decisively beyond one of the trendlines, the triangle hasn't resolved. Students should focus on monitoring trendline integrity rather than trying to predict which side will win the compression. When the breakout candle arrives, it's typically large-bodied and decisive — that's how students recognize the resolution. **Volume contraction during formation is a signature, not a coincidence.** Healthy triangles see volume decline progressively as the range narrows. This reflects decreasing participation as the compression continues — fewer traders see opportunity in the narrowing range. The volume expansion at the breakout is the signature of new participation joining the resolution. Triangles that form on heavy volume throughout the formation often resolve poorly; triangles with classical volume contraction followed by expansion at breakout are higher-quality signals. **False breakouts are common and require additional confirmation.** Brief excursions through a triangle's trendline that don't follow through are one of the most common patterns of failure. Students who enter on the first wick beyond the trendline often get trapped when price returns to the triangle. The discipline is to wait for a decisive close beyond the trendline (preferably with a strong-bodied breakout candle), not just an intraday touch.
Ascending and Descending Triangles
The symmetrical triangle's two siblings work on the same principles with different structural emphasis.
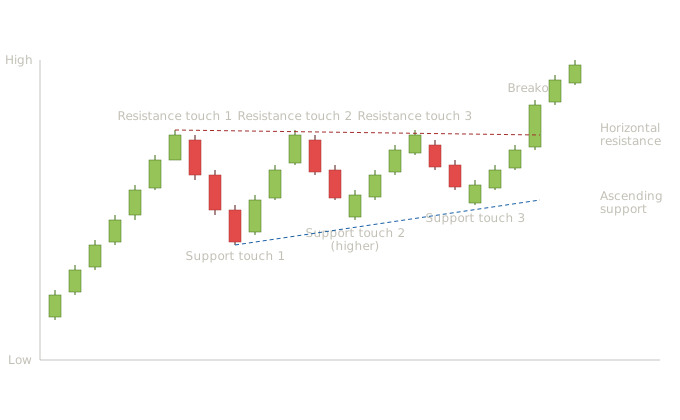
The ascending triangle is structurally distinct from the symmetrical version. The key difference: one trendline is horizontal rather than sloping. Three touches at the same upper resistance level — buyers repeatedly testing the same ceiling and failing to break through. But the lower trendline ascends — each pullback finds support at a higher level than the previous one. This asymmetry tells the underlying story. The reading habit for ascending triangles: buyers are increasingly aggressive (stepping in earlier on each pullback) while sellers are merely defending a fixed level (the horizontal resistance). When buyers and sellers fight along these terms, buyers usually win eventually. The pattern is generally regarded as bullish — the breakout is expected to occur through the horizontal resistance rather than through the ascending support. The three resistance touches at the same level are the structural feature students should look for. Each test of the resistance level brings price right back to the same ceiling. Meanwhile, the pullbacks between touches become progressively shallower — touch 1's pullback bottoms at one level, touch 2's pullback bottoms higher, touch 3's pullback bottoms higher still. This is the visible accumulation of buying pressure. The breakout candle through the horizontal resistance is typically decisive — a long bullish body, minimal upper shadow, close well above the resistance level. This is what students should wait for. Anticipation entries before the breakout occur in the right direction often but are riskier; the disciplined approach is to enter on the breakout itself or on the subsequent retest of the broken resistance from above. The descending triangle works as the bearish mirror — horizontal lower support with three touches at the same floor, descending upper resistance showing sellers stepping in earlier on each rally. The interpretation flips: sellers are aggressive while buyers merely defend a fixed level, and the breakdown is expected through the horizontal support.
Pattern Statistics and Sources
Symmetrical triangle
| Attribute | Notes |
|---|---|
| Confirmation rule | Decisive close beyond either trendline, ideally with a strong-bodied candle. Conservative entry waits for a retest of the broken trendline; aggressive entry buys or sells on the breakout close itself. |
| Volume signature | Declining volume across the formation, expanding volume at the breakout. |
| Reliability | Generally regarded as a moderately reliable continuation pattern, though reported statistics vary significantly across sources and methodologies. |
| Common failure mode | False breakout where price briefly crosses the trendline and returns into the triangle. Apex breakouts (occurring near where the trendlines would meet) are notably less reliable than mid-formation breakouts. |
Cited statistics:
LuxAlgo's review reports symmetrical triangles showing upward breakouts about 54% of the time, with the patterns known for reliability when combined with volume confirmation and multiple price closes beyond trendlines.
LuxAlgo's separate symmetrical triangle analysis shows a 54% success rate for upward breakouts and 50% for downward breakouts in their data, while noting other sources report a 75% success rate as continuation patterns when properly identified.
QuantifiedStrategies notes a methodological caution about symmetrical triangle statistics: Bulkowski's research, while extensive, is based on after-the-fact visual analysis rather than strict quantifiable rules, and students should be cautious about treating these figures as if they came from fully systematic backtests.
Ascending triangle
| Attribute | Notes |
|---|---|
| Confirmation rule | Decisive close above the horizontal upper resistance, ideally with expanding volume. |
| Volume signature | Declining volume across the formation, surging volume at the upper breakout. |
| Reliability | Generally regarded as one of the stronger continuation patterns, with a bullish bias inherent in the structure. |
| Common failure mode | False breakout above resistance that fails to follow through. Breakout in the downward direction against the pattern's bullish bias. |
Cited statistics — wide spread across sources:
LuxAlgo reports ascending triangles with a 72.77% success rate and a 77% chance of breaking upward, noting they typically appear 7 to 10 times a year on daily charts.
Liberated Stock Trader's research reports an 83% success rate for the ascending triangle with an average potential profit of 43% in bull markets, describing it as a flexible pattern that can act as either continuation or reversal depending on breakout direction relative to prior trend.
Bapital's backtesting of 2,564 ascending triangle formations across multiple markets found a 47% win rate, with an average return-to-risk ratio of 2.5 to 1. They note that higher-timeframe charts are more reliable than 5-minute or lower-timeframe charts.
Descending triangle
| Attribute | Notes |
|---|---|
| Confirmation rule | Decisive close below the horizontal lower support, ideally with expanding volume. |
| Volume signature | Declining volume across the formation, surging volume at the lower breakdown. |
| Reliability | Generally regarded as comparable to ascending triangle in mirror, with a bearish bias inherent in the structure. |
| Common failure mode | False breakdown that recovers. Breakout in the upward direction against the pattern's bearish bias — notable because failed descending triangles often produce sharp bullish reversals. |
Cited statistics:
LuxAlgo reports descending triangles with a 72.93% success rate, with about 64% breaking downward.
What the spread teaches
The reliability figures for ascending triangles range from 47% to 83% across credible sources. The same pattern is reported as moderately profitable in some studies and highly reliable in others. The methodological drivers of this spread are the ones students have now seen repeatedly:
**How strictly is the pattern defined?** Strict definitions requiring multiple specific touches, clear volume signatures, and proper trend context produce higher reliability but fewer patterns. Loose definitions counting any roughly-triangular consolidation produce more patterns but lower reliability. **How is success measured?** Reaching the measured-move target counts as success in some studies. Any directional movement after breakout counts in others. The same pattern can look 47% reliable or 83% reliable depending on the success bar. **Manual versus algorithmic detection?** Bulkowski's data uses manual identification where human judgment can favor "clean" examples. Bapital's data uses algorithmic detection applied uniformly. The gap between the two — roughly 35 percentage points — illustrates how much methodological choice affects reported reliability. For students, the practical takeaway: triangle patterns produce favorable outcomes more often than chance, but the exact expected reliability depends heavily on how strictly you're willing to define the pattern, what counts as success, and which market and timeframe you're working in. A student who understands this framing won't be surprised when their personal experience with triangles differs from a single quoted number — they'll know the variance is built into the pattern category itself.
Multi-source pool
For students who want to dig deeper into triangle pattern statistics:
- thepatternsite.com (Bulkowski) — extensive research on all three triangle variants with breakout direction frequencies, failure rates, and average post-breakout moves.
- liberatedstocktrader.com — backtests with explicit success-rate figures and average profit potential.
- luxalgo.com — research aggregation across multiple sources, with comparative figures for the three triangle variants.
- bapital.com — algorithmic backtesting with large sample sizes (thousands of patterns).
- quantifiedstrategies.com — methodological commentary alongside backtest figures, often more skeptical than other sources.
- Academic literature via Google Scholar — search "triangle chart pattern technical analysis" or "consolidation pattern breakout."
Common Student Mistakes with Triangles
Triangles require specific structure — converging trendlines with multiple touches, a clear prior trend, and a meaningful formation period. Random sideways action with no clean trendlines isn't a triangle; it's just sideways action. Students who force trendline identification onto any narrowing range end up trading false triangles constantly.
Anticipation trades inside the triangle look profitable when they work but produce constant whipsaws when they don't. The discipline is to wait for the breakout candle. Students who consistently enter inside triangles on hunches about breakout direction underperform students who wait patiently for confirmation.
A small-bodied candle barely clearing a trendline is suspect. A long-bodied candle decisively beyond the trendline is much more trustworthy. Breakout candle quality matters significantly to whether the breakout follows through. Students should evaluate the breakout candle's structure (body size, shadow proportions, close location) before treating the breakout as confirmed.
Triangles with classical volume contraction during formation and volume expansion at breakout are higher-quality than triangles with erratic volume throughout. Students who ignore volume entirely treat all triangles as equivalent — they aren't.
An ascending triangle inside a downtrend is structurally bullish but the prevailing trend is bearish — the resolution direction is more ambiguous than the pattern type alone suggests. Students should always consider both the pattern's inherent bias and the prevailing trend before forming expectations about breakout direction.
Breakouts that occur near the apex (where the trendlines have nearly converged) are notably less reliable than mid-formation breakouts. The compression has gone on too long, volume has often dried up entirely, and the eventual move lacks momentum support. Students should be skeptical of breakouts in the final third of the triangle's projected formation length.
How This Lesson Connects to What Comes Next
Lesson 20 covers flags and pennants — short continuation patterns that form after sharp directional moves. These are closely related to triangles structurally (pennants are essentially small triangles), but the surrounding price action and the formation timeframe distinguish them. Pennants and flags develop in days or weeks rather than the weeks-to-months that triangles typically require, and they appear immediately after strong directional candles rather than after extended consolidations.
Lesson 21 covers rectangles and wedges — sideways consolidations bounded by horizontal lines (rectangles) versus angled consolidations where both trendlines slope in the same direction (wedges). Wedges produce one of the more counterintuitive resolutions in chart pattern analysis — they often resolve against their slope direction, which we'll explore in detail.
Quiz — 3 Questions
Answer one at a timeA student is watching a symmetrical triangle form on a daily chart. Multiple spinning tops and dojis have appeared within the pattern over recent sessions, and the student switches their position repeatedly based on each one. What does the lesson say about interpreting these candles inside a triangle?
In this lesson
300 — Western Chart Patterns — Structure, Candle Integration, Statistics