Flags and Pennants: Short Continuation Patterns After Sharp Moves
Flags and pennants are the smallest and fastest continuation patterns in the Western technical analysis toolkit. They form in days rather than the weeks or months that triangles or rounding patterns require, and they appear immediately after sharp directional moves rather than after extended consolidations.
Flags and Pennants: Short Continuation Patterns After Sharp Moves
Flags and pennants are the smallest and fastest continuation patterns in the Western technical analysis toolkit. They form in days rather than the weeks or months that triangles or rounding patterns require, and they appear immediately after sharp directional moves rather than after extended consolidations. These patterns are particularly important for active traders because they offer rapid-cycle entry opportunities within established trends — students working on daily charts will see several per month on liquid instruments, and intraday traders will see them constantly.
The pedagogical significance of flags and pennants comes from their tight relationship with the price action that precedes them. Unlike triangles or head and shoulders patterns, which form somewhat independently of the immediate prior price action, flags and pennants are inseparable from "the pole" — the sharp move that launches them. The pole's character determines the flag's reliability, and the pole's height determines the measured-move target. Students who learn to read pole quality before evaluating flag quality have a meaningful edge in trading these patterns.
Vocabulary
| Term | Definition |
|---|---|
| Flag | A short continuation pattern that forms after a sharp directional move. The pattern consists of a small parallel channel that slopes gently against the direction of the prior move. A bull flag (forming after an upward move) slopes downward; a bear flag (forming after a downward move) slopes upward. The pattern resolves through a breakout in the direction of the original move, resuming the prior trend. |
| Bull flag | A flag in an uptrend. Formed when a sharp upward move (the pole) is followed by a brief consolidation in a downward-sloping parallel channel. The breakout occurs through the upper trendline of the flag, resuming the uptrend. |
| Bear flag | A flag in a downtrend. Formed when a sharp downward move (the pole) is followed by a brief consolidation in an upward-sloping parallel channel. The breakout occurs through the lower trendline of the flag, resuming the downtrend. |
| Pennant | Structurally similar to a flag but with converging trendlines instead of parallel ones. Where a flag is a small parallel channel, a pennant is a small symmetrical triangle. Both serve the same function — brief consolidation after a sharp move — but pennants compress price action more aggressively. The breakout direction follows the same logic: continuation of the prior trend. |
| Pole | The sharp directional move that precedes the flag or pennant. The pole's height becomes the basis for the measured-move target after breakout. Strong poles (sharp, sustained moves with strong candle bodies and ideally heavy volume) produce more reliable flag continuations than weak poles. |
| Flag pole height | The vertical distance from the start of the pole's strong directional move to the high (for bull flags) or low (for bear flags) reached at the pole's completion. This distance is projected from the flag's breakout point in the breakout direction to establish the measured-move target. |
| Flag duration | The time period over which the flag forms. Classical flags resolve within 1-4 weeks on daily charts. Flags that take longer than this often evolve into triangles or rectangles, which have different reading habits. The "short and quick" character of the consolidation is part of what defines the pattern. |
| Counter-trend slope | The defining structural feature of a true flag. A bull flag must slope downward (against the uptrend it pauses); a bear flag must slope upward (against the downtrend it pauses). A consolidation that slopes in the same direction as the prior move isn't a flag — it's either a continuation of the prior move or an early-stage triangle. |
| Bilateral flag (rectangle within a trend) | A consolidation that forms a horizontal channel rather than an angled one. Technically this is a small rectangle rather than a true flag, but functionally it serves the same role: brief consolidation before trend resumption. Some textbooks treat horizontal flag-like consolidations as a separate pattern category; others fold them into the broader flag family. |
Anatomy of a bull flag with candle integration
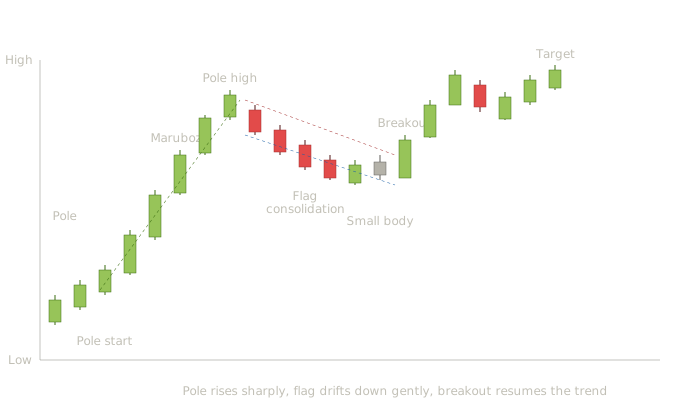
The bull flag illustrates one of the most useful patterns for active traders because it produces frequent, high-quality entry opportunities within established trends. The candle-level reading is what separates strong flags from weak ones. The pole's setup (candles 1-3). Three moderate bullish candles establish that an uptrend exists. These aren't yet "the pole" — they're the lead-in that establishes the trend context. Without a prior trend, the sharp move that follows wouldn't be a pole; it would just be a directional spike. The pole itself (candles 4-7). Four long bullish candles drive price up at a steep angle. Look at the candle structure carefully — these are large bodies with minimal upper shadows, near-marubozu candles from Lesson 2. Each closes near its high, signaling that buyers controlled each session decisively from open to close. This is what a strong pole looks like. Pole quality matters enormously for flag reliability. A pole built from long bullish marubozu candles with minimal upper shadows signals real institutional buying — large orders absorbing all available supply and pushing price higher with conviction. A pole built from candles with long upper shadows (buyers pushed up but couldn't hold the highs) is weaker, and the subsequent flag is more prone to failure. Students should specifically evaluate pole candle structure before evaluating flag structure. The flag consolidation (candles 8-12). Five candles produce a gentle downward drift in a narrow channel. The candle character here is dramatically different from the pole: smaller bodies, less conviction, mix of red and green sessions. From Lesson 2's vocabulary, the candles are short-bodied rather than long-bodied. This shift is what makes the consolidation a healthy pause rather than the start of a reversal. The small body in the middle of the flag (candle 11) is particularly telling. After several sessions of mild bearish drift, a tiny-bodied session appears — neither side is making significant progress. This is the kind of equilibrium that often precedes a flag breakout. Students should specifically watch for shrinking candle bodies within the flag as a signal that the consolidation is approaching resolution. The breakout candle (candle 12). A long bullish candle breaks above the flag's upper trendline. The body is large relative to the flag's compressed candles, the close is well above the breakout level, and the structure is near-marubozu — minimal upper shadow, body spanning most of the range. The breakout candle's quality matters here just as it did for triangles in Lesson 19. A weak breakout (small body, long shadows, close near the trendline) is suspect. A strong breakout candle confirms that the trend is decisively resuming. The second leg up (candles 13-15). Three more bullish candles drive price toward the measured-move target. The target is calculated by taking the pole's height (from its start to its peak) and projecting that distance upward from the flag's breakout point. Notice how the second leg's character resembles the pole's character — long bullish bodies, minimal upper shadows. This is the trend resumption playing out structurally. A brief mid-leg pullback (candle 16). One small bearish candle appears partway through the second leg. This isn't a reversal — it's just a brief session of profit-taking within the broader trend continuation. Real markets produce these small counter-trend sessions constantly, and they shouldn't shake students out of the trade. Continuation to target (candles 17-19). Three more bullish candles complete the move toward the measured-move target. The pattern has played out structurally.
The bull flag teaches a specific reading pattern that distinguishes flag analysis from triangle analysis:
**Pole quality is the entry filter.** Students who only look at flag structure miss the most important variable — the pole. A weak pole produces a weak flag regardless of how textbook the consolidation looks. A strong pole (long marubozu bodies, minimal counter-trend shadows, ideally heavy volume) sets up flags that follow through reliably. **The candle character change within the flag confirms it's not a reversal.** The shift from long-bodied conviction candles in the pole to short-bodied mixed-color candles in the flag is what signals consolidation. If the flag candles look as decisive as the pole candles but pointing in the opposite direction, that's not a flag — it's a reversal in progress. **The flag's slope matters.** Bull flags must slope downward against the uptrend. A consolidation that slopes upward (continuing in the trend direction) isn't really a flag because it's not actually pausing the trend; it's just extending it at a slower pace. A consolidation that slopes downward steeply (significantly against the trend) isn't a flag either — it's a deeper pullback that may signal reversal. **Flag duration matters.** Classical bull flags resolve within 1-4 weeks on daily charts. Flags that take longer than this start to lose their character — what was a quick pause becomes an extended consolidation, and the structural integrity that made the flag work begins to deteriorate. Students should be particularly attentive to time, not just price structure.
Pennants — the converging cousin
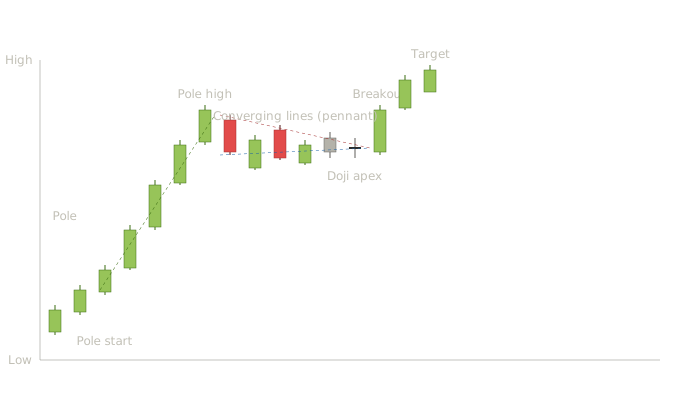
The pennant is structurally similar to the flag but with a key difference: the two trendlines converge rather than running parallel. Where a flag traces a small parallel channel sloping against the prior trend, a pennant traces a small symmetrical triangle — essentially a miniature version of the Lesson 19 triangle pattern, but on a much shorter timeframe and immediately after a sharp directional move rather than after extended price action. The pole (candles 1-7). Same structure as the bull flag pole — three setup candles followed by four long bullish near-marubozu candles driving price up at a steep angle. Strong pole quality with conviction candles. This is the directional move the pennant will pause. Early pennant candles (candles 8-12). Five candles oscillate within a converging range. Notice the mix of red and green sessions — neither side is winning consistently. The bodies are smaller than the pole candles, the range of each session is narrower than the pole sessions, and the overall structure traces a converging triangle rather than a parallel channel. The pennant compresses price action more aggressively than the flag does. The doji at the apex (candle 13). As the converging trendlines approach their meeting point, a doji appears. From Lesson 2, this is maximum indecision — open and close at essentially the same price. This is the canonical signal that the pennant is approaching resolution, exactly the way it was for the symmetrical triangle in Lesson 19. The compression has reached the point where one side will overwhelm the other in the next sessions. The breakout candle (candle 14). A long bullish candle breaks decisively above the pennant's upper trendline. The body is large relative to the compressed pennant candles, close well above the breakout level, near-marubozu structure. The contrast between this candle and the small candles inside the pennant is what students should look for when evaluating breakout quality. Continuation to target (candles 15-16). Two more bullish candles drive price toward the measured-move target — the pole's height projected upward from the breakout point.
The two patterns serve identical functions (brief continuation pauses after sharp moves) but they form differently in ways that matter: Flags maintain consistent counter-trend pressure. A bull flag's downward slope is sustained throughout the consolidation. Each successive low is slightly lower than the previous; each successive high is also slightly lower. The market is taking a small organized pullback before resuming. Pennants show compressing volatility. A pennant's converging trendlines mean the range is narrowing session by session. The market isn't pulling back so much as it's pausing in increasingly tight equilibrium before the trend resumes. Functionally they produce similar outcomes, but the candle character within them differs subtly. Flag candles tend to be moderate-bodied with mild counter-trend bias. Pennant candles tend to be progressively smaller as the apex approaches, with mixed colors and frequent indecision sessions (spinning tops, dojis).
Pattern statistics and sources
Bull flag
| Attribute | Notes |
|---|---|
| Confirmation rule | Decisive close above the flag's upper trendline, ideally with expanding volume. Conservative entry waits for retest of the broken trendline; aggressive entry buys on the breakout candle close. |
| Volume signature | Heavy volume during the pole, declining volume during the flag consolidation, expanding volume at the breakout. The volume contraction during the flag is one of the best confirmations that the consolidation is a healthy pause rather than distribution. |
| Reliability | Highly variable across sources, with reliability strongly dependent on flag quality. "High-tight" flags (sharp pole, shallow flag, fast resolution) are generally regarded as the most reliable variant; loose or extended flags fail far more often. |
| Common failure mode | Flag retraces more than 50% of the pole's height, signaling that the consolidation is too deep to be a healthy pause. False breakout that fails to follow through within 1-2 sessions. |
Cited statistics — note the wide spread:
Liberated Stock Trader's research distinguishes between flag types, finding that most bull flags have a failure rate of 55% based on 1,028 trades. The high-tight bull flag specifically has an 85% success rate on upside breakout with an average 39% profit in bull markets. Loose bull flags have a 55% failure rate with only a 9% average gain when they do work.
Vocal Media's analysis reports bull flag success rates between 50% to 60% depending on market conditions and confirmation, with the pattern losing reliability significantly if the flag retraces more than 50% of the flagpole.
VT Markets' 2026 research indicates that properly backtested flag trading strategies maintain 65-72% success rates across diverse market conditions when incorporating appropriate filters and risk management protocols.
Bear flag
| Attribute | Notes |
|---|---|
| Confirmation rule | Decisive close below the flag's lower trendline, ideally with expanding volume. |
| Volume signature | Heavy volume during the bearish pole, declining volume during the upward-sloping consolidation, expanding volume at the breakdown. |
| Reliability | Comparable to bull flag in mirror, with the same caveats about flag tightness and retracement depth. |
| Common failure mode | Same as bull flag mirror — flag retraces too far up, false breakdown that recovers. |
Cited statistics:
VT Markets reports bear flag patterns rank among the most reliable continuation patterns with success rates ranging from 78-86% depending on market conditions and confirmation criteria. The highest success rates occur when the pattern demonstrates clear volume characteristics (high during flagpole, low during consolidation, expanding on breakout), forms within a strong existing trend, and receives confirmation from other technical indicators. Bear flags within established downward trends have higher success rates around 82% compared to those in transitioning markets at approximately 68%.
Dukascopy's analysis reports bear flag success rates around 65-70% based on various studies and backtests. They note the reliability tends to increase when the pattern forms after a strong downward move and breaks down with high volume.
Pennants (bullish and bearish)
| Attribute | Notes |
|---|---|
| Confirmation rule | Decisive close beyond the appropriate converging trendline in the direction of the prior trend. |
| Volume signature | Same as flags — heavy on pole, declining during consolidation, expanding at breakout. |
| Reliability | Generally regarded as comparable to flags, with similar quality-dependent variance. |
| Common failure mode | Apex breakout (resolution too late in the formation), false breakout that returns into the converging structure. |
Cited statistics:
QuantifiedStrategies notes that strict quantified backtests of bear flag and pennant patterns are difficult because of the structural rules required for valid identification. Their analysis relies on Bulkowski's research from The Encyclopedia of Chart Patterns covering 500 stocks over 5 years, while cautioning that his findings are based on visual confirmation rather than fully systematic backtests.
Asia Forex Mentor's backtest of a flag and pennant strategy across multiple markets found a 90% win rate for AAPL stocks, 80% for EURUSD forex, and 50% for BTC crypto. The wide variance across instruments illustrates how dramatically market-specific behavior affects flag pattern reliability.
What the wide spread teaches
Bull flag reliability ranges from 50% to 85% across credible sources, with the spread driven primarily by whether researchers distinguish between flag types. The Liberated Stock Trader finding is particularly important pedagogically: when bull flags are tested as a single category, the average success rate looks unimpressive at around 45%. When they're broken down into "high-tight" flags versus "loose" flags, the high-tight variant produces 85% success while the loose variant produces 55% failure. The aggregate statistic obscures a meaningful quality distinction. This is one of the most important teaching points for the entire chart pattern section: pattern quality varies enormously within a single named category. A textbook "bull flag" can be a high-probability setup or a low-probability setup depending on structural details that students need to learn to distinguish. Pole strength, flag tightness, flag duration, retracement depth, and volume signature all affect the pattern's actual reliability. A student who trades all bull flags identically will get average results. A student who selects for high-quality bull flags specifically will get dramatically better results. The Asia Forex Mentor backtest with 90% / 80% / 50% reliability across AAPL, EURUSD, and BTC shows the same principle from a different angle: even when the pattern definition is held constant, different markets produce different reliability. Bull flags on liquid US equities perform differently than bull flags on forex pairs, which perform differently than bull flags on crypto. Students should not assume that a reliability number from one market transfers cleanly to another. For your students, the practical takeaway: flags and pennants produce favorable outcomes much more often than chance when the pattern quality is high and the market context supports them. Quality is the variable students need to learn to evaluate, not just the pattern's structural identification. A loose flag in a choppy market is a low-probability trade regardless of the textbook definition matching. A tight flag in a strong trend in a liquid instrument is a high-probability trade with the same textbook definition.
Multi-source pool
For students who want to dig deeper into flag and pennant statistics:
- thepatternsite.com (Bulkowski) — entries for high-tight flags, regular flags, and pennants with reliability rankings, failure rates, and average post-breakout moves.
- liberatedstocktrader.com — backtests that distinguish between flag quality types, particularly useful for understanding the high-tight versus loose distinction.
- quantifiedstrategies.com — methodological commentary alongside backtest figures, often more skeptical than other sources.
- vtmarkets.com — recent 2025-2026 research with market-context breakdowns.
- dukascopy.com — research aggregation across multiple sources.
- Academic literature via Google Scholar — search "flag pattern technical analysis" or "continuation pattern profitability."
Common student mistakes with flags and pennants
Real flags require specific structure — a strong pole, a tight counter-trend channel, limited retracement depth, short duration. Random consolidation after any upward move isn't a bull flag; it's just consolidation. Students who lower their identification standards to find more "flags" end up trading low-quality patterns that fail at high rates.
A weak pole produces an unreliable flag regardless of how textbook the consolidation looks. Students should specifically evaluate the pole's candle structure — long marubozu-style bullish bodies with minimal upper shadows signal real institutional buying, while poles built from candles with long counter-trend shadows signal weaker conviction. Pole quality should be the first filter, not an afterthought.
Bull flags should retrace less than 50% of the pole's height. Flags that retrace more than this lose their structural integrity — what was supposed to be a brief pause has become a deeper consolidation that's structurally different from a flag. Students who trade flags retracing 60-70% of the pole are essentially trading deeper continuation patterns disguised as flags.
Classical bull flags resolve within 1-4 weeks on daily charts. Flags that take longer than this evolve into rectangles or triangles, which have different reading habits. Students should pay attention to duration as much as to price structure.
Flags have parallel trendlines; pennants have converging ones. Both work similarly but the structural distinction matters for the way the pattern resolves — pennants tend to resolve at the apex while flags can break out at various points along their channel. Students who treat the two patterns identically miss subtle differences in entry timing.
The breakout candle from a flag or pennant should be strong-bodied and decisive. A small-bodied breakout barely clearing the trendline is suspect. A long-bodied marubozu-style breakout with strong close is much more trustworthy. The candle-level reading from Lesson 2 directly informs flag-breakout evaluation.
Real flags show a clear shift from the pole's strong directional candles to smaller, less convicted consolidation candles. If the flag candles look as decisive as the pole candles but pointing the opposite way, the pattern isn't really a flag — it's an early-stage reversal. The candle-body trajectory reading from Lesson 18 directly applies to flag evaluation.
How this lesson connects to what comes next
Lesson 21 covers rectangles and wedges — sideways consolidations bounded by horizontal lines (rectangles) versus angled consolidations where both trendlines slope in the same direction (wedges). These complete the continuation pattern family with patterns that develop more slowly than flags and pennants but follow similar principles. Wedges produce one of the more counterintuitive resolutions in chart pattern analysis — they often resolve against their slope direction, which makes them structurally different from the patterns covered so far.
Lesson 22 covers cup and handle patterns and other formations that don't fit cleanly into reversal-versus-continuation categories. By the end of Lesson 22, students will have the full Western chart pattern vocabulary.
Lesson 23 builds the chart pattern interpretation framework — the parallel to Lesson 12 for candles. Location, magnitude, volume confirmation, measured-move targets, failure modes, multi-timeframe context — the dimensions that turn pattern recognition into trade decisions.
Lesson 24 is the synthesis lesson where candle and chart analysis come together formally. Students who've been getting the integrated reading across all the chart pattern lessons will see the full multi-timeframe approach laid out as a complete methodology.
Combined chart: V-bottom into bull flag into symmetrical triangle
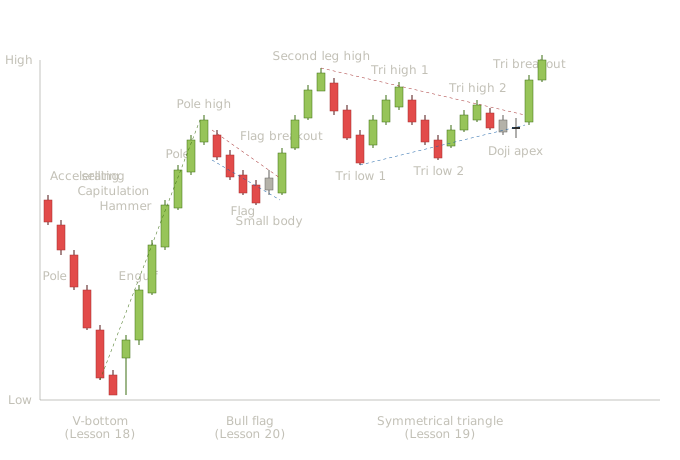
This chart shows three patterns chained together in a single price sequence that traces a complete trading cycle. A violent capitulation reversal launches a strong uptrend, the trend pauses briefly through a tight flag, and a deeper triangle consolidation precedes the final leg. Students will see this exact sequence on real charts constantly — it's one of the most common multi-pattern chains in bullish trend development. The accelerating decline (candles 1-5). Five bearish candles drive price lower with progressively expanding bodies. From the Lesson 18 reading habit, the candle-body trajectory tells the story: each successive session shows more aggressive selling than the last, signaling building panic rather than fading momentum. The fifth candle is the climactic session — a long bearish near-marubozu pushing price to the chart's low with minimal lower shadow. The hammer at the V-low (candle 6). A small bullish body sits near the top of a long lower shadow. From Lesson 3, this is the classical hammer reversal candle. The four-dimension quality framework reads ideal: location at a capitulation low after an extended decline, magnitude with the lower shadow significantly longer than the body, and immediate context with the accelerating bearish candles preceding it. This is the V-reversal turning point. The bullish engulfing confirmation (candle 7). A long bullish candle opens below the hammer's close and rallies powerfully to engulf the hammer's body completely. From Lesson 5, this is the bullish engulfing pattern stacked immediately after the hammer — two reversal signals back-to-back at the climax low. This is the strongest possible candle-level configuration for a V-reversal. The pole formation (candles 8-11). Four long bullish candles drive price up at a steep angle. Each candle is a near-marubozu — large body, minimal upper shadow, close near the high. From Lesson 2, this is one-sided buyer control session after session. This is what a strong pole looks like, and pole quality determines flag reliability. The flag consolidation (candles 12-16). Five candles trace a small downward-sloping channel. Notice the candle character change from the pole: smaller bodies, mix of red and green sessions, less directional conviction. From Lesson 20's reading habit, this is exactly what a healthy flag should look like — short-bodied candles in a gentle counter-trend drift rather than long-bodied conviction candles continuing the move. The small body in the middle of the flag (candle 16) shows the equilibrium that often precedes flag breakouts. After several sessions of mild bearish drift, a tiny-bodied session signals that neither side is making progress — the flag is approaching resolution. The flag breakout (candle 17). A long bullish near-marubozu breaks above the flag's upper trendline. The body is dramatically larger than the flag's compressed candles. This is the decisive resumption signal that confirms the trend continues through the flag and beyond. The second leg up (candles 18-20). Three more bullish candles drive price to the chart's high. The second leg's character resembles the pole's character, which is what students should expect — flags project a measured move equal to the pole's height, and the move toward that target typically displays similar candle conviction to the original pole. The triangle's first decline (candles 21-23). Three bearish candles begin a deeper pullback than the flag was. The depth of this pullback already signals to students that whatever forms next will be larger and longer than the flag — this is a more substantial consolidation, not just a brief pause. Triangle low 1 (candle 23). Price reaches the level that will become the lower trendline anchor. At this point, students don't yet know a triangle is forming — only that the pullback has bottomed. Rally toward triangle high 1 (candles 24-26). Three bullish candles drive price back up but fail to reach the second leg's high. From Lesson 19's reading habit, this failure to make a new high is the structural shift that begins the triangle. The contracting oscillations (candles 27-32). Price oscillates between progressively narrower extremes. Lower highs trace the descending upper trendline; higher lows trace the ascending lower trendline. The candles inside the triangle get progressively smaller — exactly the candle-body trajectory that signals triangle compression rather than directional pressure. From Lesson 19, this is the canvas-not-signal reading: indecisive candles inside a forming triangle are the normal canvas, not individual reversal signals. The doji at the apex (candle 33). As the trendlines converge, a doji appears. Maximum indecision at maximum compression. This is the canonical signal from Lesson 19 that the triangle is approaching resolution — the market can't sustain this level of indecision indefinitely. The triangle breakout (candle 34). A long bullish near-marubozu breaks decisively above the descending upper trendline. The body is large relative to the compressed triangle candles, close well above the breakout level. This is the high-quality breakout candle that confirms the triangle's resolution in the bullish direction. The final continuation (candle 35). One more bullish candle drives price toward the triangle's measured-move target.
This sequence demonstrates the patterns serving different roles within a single trending move: Reversal pattern (V-bottom) initiates the trend. The hammer and bullish engulfing at the capitulation low time the entry. The strong pole that immediately follows confirms the reversal has real conviction behind it. Continuation pattern with short timeframe (bull flag) lets the trend rest briefly without losing momentum. The candle character change within the flag — from pole's long conviction bodies to flag's short consolidation bodies — confirms the pause is healthy rather than indicating reversal. The flag's quick resolution (5 sessions) is part of what makes it a flag rather than a deeper consolidation. Continuation pattern with longer timeframe (symmetrical triangle) lets the trend rest more substantially before the final push. The triangle takes longer than the flag (10 sessions versus 5), shows deeper compression, and includes multiple oscillations that the flag doesn't have. Different consolidation depth, different reading habits, same ultimate outcome: trend continuation.
Different continuation patterns serve different points in a trend's life cycle. After a sharp directional move, the market typically needs a brief pause to digest gains before the next leg — that's what flags and pennants provide. After an extended trend with multiple legs, the market often needs deeper consolidation to attract new participants and shake out weak hands — that's what triangles, rectangles, and wedges provide. Students who recognize this progression can read trend health from pattern type alone. Trends that consolidate through tight flags are showing controlled, healthy advance. Trends that consolidate through wider triangles are showing maturity — the move is getting tired and needs longer rest periods. Trends that consolidate through deeper, longer rectangles or rounding tops are often showing the late stages where reversal becomes increasingly possible.
A trader watching this chart had several high-quality entries available: The bullish engulfing at the V-bottom — earliest entry, requires confidence that the capitulation is genuine. The pole's early candles — re-entry for traders who missed the initial reversal but recognized the pole was forming. The flag breakout — second entry opportunity with the cleanest structural setup, since the flag provides a clear trigger and tight stop placement just below the flag's lower trendline. The triangle breakout — third entry opportunity, latest in the sequence, with the cleanest stop placement and the longest measured-move target remaining. Each entry has different risk-reward characteristics. Earliest entries capture more of the total move but require more conviction. Later entries miss the early portion but offer tighter stops and structural confirmation. Skilled traders don't insist on catching every entry — they recognize that established trends offer multiple participation points and choose entries that suit their timeframe, risk tolerance, and the specific pattern quality at each opportunity.
This chart practices three distinct reading habits students need to maintain: At the V-bottom: read individual candle patterns at the climax. Hammer plus bullish engulfing is what timed the entry. The chart pattern context (capitulation low after accelerating decline) added quality to the candle signals. At the flag: read candle character change. The shift from pole's long bodies to flag's short bodies confirmed the consolidation was healthy. Individual candles within the flag are not signals — they're the canvas of the consolidation. At the triangle: read candle-body trajectory across multiple sessions. The progressive shrinking of bodies and the doji at the apex signal the compression's approaching resolution. Indecisive candles inside the structure are expected; the breakout candle is the signal that matters. These three reading habits are different skills that students need to develop separately. The combined chart exercises all three within a single price sequence.
The valuable exercise after working through this chart is to find similar sequences on real charts. Have students pull up daily charts of liquid trending stocks during recent multi-month rallies and look for V-bottom or sharp reversal patterns that launched the trend, flag consolidations that paused it briefly, and triangle or rectangle consolidations that paused it more deeply. Real examples won't be as textbook-clean as this illustration. There will be additional noise, irregular candle behavior at critical moments, occasional sub-patterns that didn't quite complete. But the underlying structure of "reversal pattern initiates trend, fast continuation patterns extend trend, slower continuation patterns provide deeper rest" recurs constantly in real price action. Students who can identify three real-world examples of multi-pattern chains like this on charts they pull up themselves have crossed the important threshold from pattern recognition to integrated price-action reading. That integrated reading is what Lesson 24 will formalize as the complete methodology.
Combined chart: double bottom into bull flag into symmetrical triangle
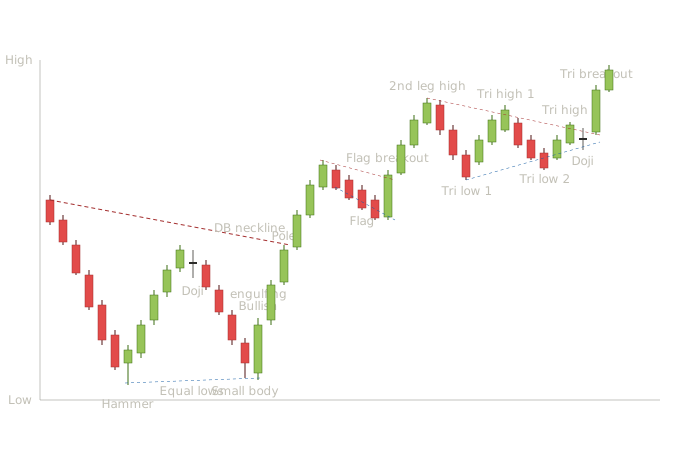
This chart shows three patterns chained together in a single price sequence — exactly what students will see when watching real markets over weeks or months on daily charts, or over hours on intraday charts. The progression tells a complete story: a major reversal initiates an uptrend, a quick consolidation lets the trend rest, and a deeper consolidation lets the trend rest again before resuming. The downtrend leading in (candles 1-6). Six bearish candles establish the prevailing downtrend with progressively expanding bodies. The fifth and sixth candles are particularly long-bodied — heavy selling pressure with conviction. This is the context the double bottom will reverse. Hammer at the first trough (candle 7). A small bullish body sits near the top of a long lower shadow. From Lesson 3, this is the hammer — sellers drove price down during the session but buyers absorbed the selling and pushed the close back up. The four-dimension quality check passes: location is excellent (after an extended downtrend), magnitude is meaningful (the lower shadow is much longer than the body), and confirmation arrives on subsequent sessions. The rally to the double bottom neckline (candles 8-11). Four bullish candles drive price up to what will become the neckline. The candles are healthy moderate-bodied bullish sessions showing steady buying. Doji at the neckline (candle 12). Indecision at the resistance level — the rally's high marks where the first leg of recovery has paused. This doji defines the neckline level. The pullback to the second trough (candles 13-16). Four bearish candles drive price back down toward the prior low. Notice the candles get progressively smaller as the decline approaches the prior trough — fading bearish pressure is the warning signal we covered in Lesson 17. By candle 16, the small body shows seller exhaustion approaching. Bullish engulfing at the second trough (candle 17). A long bullish candle opens below candle 16's close and rallies powerfully to engulf its body completely. From Lesson 5, this is the bullish engulfing pattern. Location is ideal (at the prior trough's level, defining the second touch of the double bottom), magnitude is strong (large body relative to recent candles), and the structural significance is high (this is the second trough of the double bottom completing with candle-level confirmation). The pole — first leg up (candles 18-22). Five consecutive long bullish candles drive price upward rapidly. Each candle has a substantial body, minimal upper shadow, close near the high. From Lesson 2, these are near-marubozu candles — one-sided buyer control. This is "the pole" that the upcoming flag will hang from. The neckline of the double bottom gets broken decisively during this sequence, confirming the reversal pattern. The bull flag consolidation (candles 23-26). Four moderate bearish candles produce a small downward-sloping channel. Notice the candles here are different from the pole candles: smaller bodies, less conviction, gentle decline. The flag is a pause, not a reversal. The price action sits inside a small parallel channel sloping gently against the prior strong move. Volume during a real flag would typically be light — distinguishing a healthy pause from genuine distribution. Flag breakout (candle 27). A long bullish candle breaks above the flag's upper trendline. The body is large relative to the consolidation candles, the close is well above the breakout level. This is the resumption signal — the trend that the pole established is continuing through the flag and beyond. The second leg up (candles 28-30). Three more bullish candles drive price to the chart's high. This is the continuation phase that the flag was preparing for. Notice how the second leg's magnitude approaches the pole's magnitude — flag patterns project a measured move equal to the pole's height, and that projection often plays out. The pullback after the rally high (candles 31-33). Three moderate bearish candles begin a deeper consolidation than the flag was. This is the start of what becomes the symmetrical triangle. The depth of this pullback already tells students that whatever consolidation follows will be larger and longer than the flag — it's not just a brief pause. Triangle low 1 (candle 33). Price reaches the level that will become the lower trendline anchor and reverses. At this point students don't yet know a triangle is forming. Rally toward triangle high 1 (candles 34-36). Three bullish candles rally up but fail to reach the prior rally high. This failure to make a new high is the structural shift that begins the triangle — and it parallels what students saw in the double top of Lesson 17, except here the broader context is a still-bullish trend, so the failure is a pause rather than a reversal. The contracting oscillations (candles 37-43). Price oscillates between progressively narrower extremes. Lower highs (candles 38, 42) trace the descending upper trendline of the triangle. Higher lows (candles 41, 44) trace the ascending lower trendline. The candles within the triangle get smaller as the compression continues — exactly the candle-body trajectory pattern from Lesson 19 that signals a triangle is forming rather than a reversal. Doji at the triangle apex (candle 44). As the trendlines converge near the apex, a doji appears. Maximum indecision at maximum compression. This is the canonical signal that the triangle is approaching resolution — the market can't sustain this level of indecision and one side will overwhelm the other in the next sessions. Triangle breakout (candle 45). A long bullish candle breaks decisively above the descending upper trendline. The body is large relative to the compressed triangle candles, the close is well above the breakout level, the structure is near-marubozu. From Lesson 19, this is the high-quality breakout candle that confirms the triangle's resolution in the bullish direction. Continuation toward target (candle 46). Price drives higher toward the triangle's measured-move target — the triangle's height at its widest point projected upward from the breakout.
The three patterns form a coherent narrative that students need to internalize because real markets produce these sequences constantly: Reversal pattern (double bottom) → initiates a new trend. The hammer at the first trough and bullish engulfing at the second trough are the candle-level signals timing the reversal. The neckline break confirms the pattern structurally. Continuation pattern within strong trend (bull flag) → brief pause before the trend resumes. The candle-level character changes within the flag — smaller bodies, less conviction — signaling consolidation rather than reversal. The breakout candle is decisive and large-bodied. Continuation pattern after extended trend (symmetrical triangle) → deeper consolidation before another resumption. The triangle takes longer and shows more pronounced compression than the flag. Indecision candles (the doji near the apex) are normal within the structure rather than warning signs. The breakout candle is again decisive.
Different continuation patterns suit different points in a trend's life cycle. Flags appear immediately after sharp directional moves — they're the quick rest. Triangles appear after extended moves where the market needs deeper consolidation — they're the longer rest. Both patterns produce similar outcomes (trend continuation) but require different patience and different reading habits.
A trader watching this chart had multiple high-quality entries available: The bullish engulfing at the double bottom's second trough — earliest entry, requires confidence that the reversal will follow through. The double bottom neckline break during the pole — slightly later, with clearer structural confirmation. The flag breakout — re-entry opportunity for traders who missed the initial reversal or want to add to existing positions. The triangle breakout — second re-entry opportunity, latest in the sequence but with the cleanest setup because the triangle's compression generates a powerful release. Each entry has different risk-reward characteristics, but all are valid because the chart and candle layers agree at each critical moment. Skilled traders don't just enter once — they recognize that established trends offer multiple participation points through continuation patterns that students can identify with the patterns and signals from Lessons 17, 19, and 20.
This exact sequence — double bottom into bull flag into symmetrical triangle into continuation — appears on monthly charts over years, daily charts over months, and intraday charts over hours. Day traders watching one-minute charts see this sequence multiple times per week on active instruments. Swing traders on daily charts see it several times per year. Position traders on weekly charts see it across multi-year cycles. The reading is identical at every timeframe.
The exercise that consolidates this learning: have students pull up real daily charts of liquid instruments and look for similar multi-pattern sequences. The instances on real charts won't be as textbook-clean as this illustration — there will be additional noise, sometimes irregular candle behavior at the critical moments, occasional sub-patterns that didn't quite complete. But the underlying structure of "reversal pattern initiates trend, continuation patterns extend trend" recurs constantly. Students who can identify three real-world examples of multi-pattern chains like this on charts they pull up themselves have crossed an important threshold. They're no longer just identifying isolated patterns — they're reading the chart as an integrated whole where each pattern relates to what came before and prepares what comes next. That integrated reading is what skilled traders actually do, and it's the synthesis that Lesson 24 will formalize.
Quiz — 3 Questions
Answer one at a timeA student sees what looks like a textbook bull flag: a tight downward-sloping consolidation, small-bodied candles, appropriate duration. But the pole that preceded it was built from candles with large upper shadows — buyers pushed price up during each session but couldn't hold the gains. The student enters on the flag breakout. What does the lesson say about this decision?
In this lesson
300 — Western Chart Patterns — Structure, Candle Integration, Statistics