Pipe Tops and Pipe Bottoms
Pipe tops and pipe bottoms are sharp two-candle reversal patterns discovered and named by Thomas Bulkowski. They sit at the boundary between candle patterns and chart patterns — structurally they're a small two-candle formation like many candle patterns from Lessons 1-13, but they're typically described in the chart pattern literature alongside formations like head and shoulders and double tops because they perform best on weekly charts where their structural significance is most pronounced.
- Identify pipe tops and bottoms using the matched-extremes requirement (both candles reaching approximately the same high or low)
- Distinguish pipes from tweezer tops (Lesson 6) using the substantial-body requirement
- Read the pipe top's candle sequence (bullish first pipe + bearish second pipe = failed test at the high) as the reversal's structural logic
- Apply the weekly-chart preference rule — pipes on weekly charts have materially higher reliability than pipes on daily or intraday charts
- Place stops using the pipe's tight stop-loss advantage — just beyond the matched extremes
- Interpret Bulkowski's sample sizes (8,800+ pipe bottoms, 4,000+ pipe tops) in context of their dominance as the single-researcher statistics pool
The pattern's name comes from its visual appearance: two long parallel candles standing side by side like a pair of pipes, with their bodies and shadows reaching roughly the same extremes. When this configuration appears at the end of a trend, it often signals a sharp reversal because the two parallel candles represent a sudden double-test of an extreme price that gets rejected both times. The pattern's value comes from its specific identification requirements and its strong performance on higher timeframes, making it particularly valuable for swing traders and position traders who watch weekly charts.
What makes pipes pedagogically distinctive is their tight stop-loss placement opportunity. Because the pattern consists of just two candles at an extreme, the stop can sit just above the pattern's high (for pipe tops) or just below its low (for pipe bottoms), creating favorable risk-reward ratios for traders who enter at confirmation. This is structurally different from broader patterns like head and shoulders where stops typically need to sit substantially above or below the pattern's extreme.
Vocabulary
| Term | Definition |
|---|---|
| Pipe top | A bearish reversal pattern at the end of an uptrend, consisting of two adjacent long bearish candles (or one bearish and one bullish with reversed structure) that reach approximately the same extreme high. The two candles' upper shadows or bodies form parallel vertical structures resembling pipes when viewed together. The pattern most commonly appears on weekly charts and signals that an uptrend has been tested twice at the same high and rejected both times. |
| Pipe bottom | The bullish mirror. Two adjacent candles that reach approximately the same extreme low, forming parallel pipe-like structures pointing downward. Appears at the end of downtrends and signals that the support level was tested twice and held both times. |
| Adjacent candles | The two candles forming the pipe must be immediately next to each other. There can be no intervening candles between them. This adjacency is a structural requirement that distinguishes pipes from broader two-touch tests that develop over more time. |
| Parallel shadows or bodies | The defining visual feature. The two candles' upper shadows (for pipe tops) or lower shadows (for pipe bottoms) should reach approximately the same extreme price. The shadows or bodies should appear visually parallel when viewed together — like two pipes standing side by side. Perfect equality isn't required; a few ticks of variation is acceptable, but the visual impression should clearly suggest parallel structures. |
| Pipe height | The vertical distance from the pipe's extreme (the matching highs for pipe tops, matching lows for pipe bottoms) to the closer of the two candles' opposite extreme. This measurement determines the measured-move target after confirmation. |
| Confirmation candle | A third candle following the pipe that closes in the reversal direction beyond the pipe's structural extreme. For pipe tops, the confirmation candle closes below the lower of the two pipe candles' lows. For pipe bottoms, the confirmation candle closes above the higher of the two pipe candles' highs. The pattern is generally regarded as unconfirmed and untradeable until this third candle completes. |
| Weekly chart preference | Pipes perform notably better on weekly charts than on daily charts according to Bulkowski's research. The reason is structural: weekly candles capture more participation per session, so two adjacent candles reaching the same extreme on a weekly chart represents two complete weeks of market participation testing and rejecting the same level. The same test on a daily chart represents only two days of participation, which is less structurally significant. |
| Trend requirement | Like most reversal patterns, pipes require a clear prior trend to be valid. A pipe top requires a prior uptrend; a pipe bottom requires a prior downtrend. Pipes appearing in sideways or choppy action lack the structural context that gives them meaning. |
| Symmetry between the two pipe candles | The two adjacent candles should be similar in size and structure, creating the visual impression of parallel pipes. If one candle is dramatically larger or smaller than the other, the pattern is weaker. Some practitioners require both candles to be of similar magnitude before treating the formation as a valid pipe. |
| Stop-loss tightness | One of the pipe pattern's most attractive features for practical trading. Because the pattern consists of just two candles, stops can be placed just beyond the pattern's extreme (above the highs for pipe tops, below the lows for pipe bottoms). This creates much tighter risk parameters than broader reversal patterns where stops typically need to be set further from the entry. |
Anatomy of a pipe top with candle integration
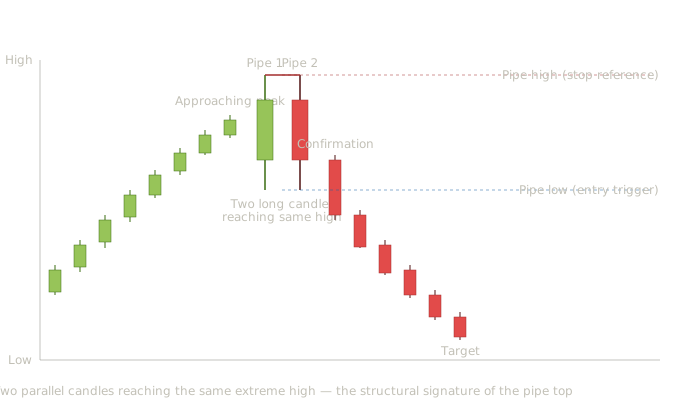
The pipe top is structurally simpler than most chart patterns we've covered — just two adjacent candles forming the core signal — but the integrated reading still tells an important story about what the pattern represents psychologically and how students should approach trading it.
Eight bullish candles drive price up with consistent moderate bodies. Each candle closes near its high, indicating steady buyer control with progressive price discovery. This is the canvas the pipe top will eventually reverse — without this prior uptrend, the formation that follows would lack the structural context that gives pipes their meaning. The bodies are similar in size throughout the rally, signaling sustainable trend rather than emotional acceleration. This is what a healthy uptrend looks like, and it's the kind of context where a pipe top's reversal is structurally significant — the trend was real and orderly, and the failure at the eventual extreme matters precisely because the rally was sustainable up to that point. Approaching the peak, the last lead-in candle is slightly smaller than the prior several — a subtle hint that buying conviction may be fading as price approaches what will become the pipe's extreme. This isn't a signal in itself; it's just a small textural detail that the careful reader notices.
The first pipe candle is a long bullish session that drives price to the eventual extreme high. Notice the candle's structure: large body relative to the prior trend candles, close near the session's high, minimal upper shadow. This is what a final push of buying conviction looks like — buyers committing aggressively as price reaches what they expect to be a continuation breakout level. But the candle's significance becomes apparent only when the next session unfolds. Until pipe 2 forms, pipe 1 looks like a normal trend candle producing a new high. A trader watching only this candle would see continued bullish progress; the pipe pattern requires the second candle to form before the reading changes.
The second pipe candle is the structural signal. This candle opens near pipe 1's close and rallies to test the same high — but instead of pushing meaningfully through, it gets rejected and closes substantially lower than its open. The result is a long bearish candle that reaches roughly the same extreme as pipe 1 but closes back down near the same low. The two candles together form the pipe structure: parallel vertical extents reaching the same high, with one bullish body and one bearish body, creating the visual impression of two pipes standing side by side. The pipe's defining feature is the matched highs — both candles reach the same approximate extreme, with the second candle's failure to push higher revealing that buyers couldn't sustain the rally beyond pipe 1's high. This is the structural reversal signal pedagogically: the market tested a specific high price on two consecutive sessions (or weeks, on weekly charts) and was rejected both times. The buyers who drove pipe 1 to the high were fully tested again on pipe 2 and couldn't repeat their success. The fact that the rejection happened on an immediately adjacent candle gives the signal urgency — the structural failure was sharp and decisive, not gradual.
Students who learned the tweezer top in Lesson 6 might recognize the visual similarity here. Tweezer tops also feature two candles reaching the same high. The distinction between pipes and tweezers: tweezer tops can have any candle structures — small bodies, doji-like, mixed colors — as long as the highs match. The pattern is more about the level being tested than about the magnitude of the test. Pipe tops specifically require both candles to be substantial — long-bodied candles whose vertical extent makes them look like pipes. The pattern is about the magnitude of the failed test, not just the test itself. Some practitioners treat pipes as a subset of tweezers (specifically, tweezers with substantial body magnitudes); others treat them as distinct patterns with stricter structural requirements. Bulkowski's research treats pipes as their own pattern category with their own reliability characteristics, particularly on weekly charts where the long-body requirement is more meaningful.
Following the pipe, the next session opens near pipe 2's close and drops decisively lower with a long bearish body. The close is well below the lower of the two pipe candles' lows, providing the structural confirmation that the reversal is real rather than a temporary pause. From Lesson 2, the confirmation candle's character matters significantly. A large-bodied bearish near-marubozu like the one shown provides strong confirmation. A smaller-bodied bearish candle that just barely closes below the pipe's low provides weaker confirmation. Students should evaluate the confirmation candle's quality before treating the pipe top as fully confirmed.
Five bearish candles continue the decline with progressively decreasing magnitude — the natural exhaustion of a directional move as it approaches its measured-move target. The target is calculated by taking the pipe's height (from the matched highs to the lower of the two pipe candles' lows) and projecting that distance downward from the confirmation candle's close.
The pipe top teaches several specific reading habits that distinguish it from broader reversal patterns: Pipes work best when the two candles are clearly substantial. A pipe formed from two small candles isn't really a pipe — it's just two small candles. The pattern's structural significance comes from the magnitude of the failed test. On weekly charts, this is more naturally satisfied because weekly candles cover a full week of market participation. On daily charts, students should specifically look for pipes formed from long-bodied candles relative to the chart's recent volatility. The confirmation candle is essential before the pipe becomes tradeable. Unlike some candle patterns where the second or third candle of the pattern provides built-in confirmation, the pipe top's two-candle structure isn't structurally complete on its own. The market could test the high a third time and break through, invalidating the pipe. The confirmation candle that closes decisively below the pipe's low is what validates the pattern as a genuine reversal rather than a temporary pause. Stop-loss placement is unusually tight. This is one of the pipe pattern's most attractive practical features. Because the pattern's structural extreme is just two candles back, stops can sit just above the matched highs (for pipe tops) or just below the matched lows (for pipe bottoms). On a real trade, this often creates risk-reward ratios of 1:3 or better — risking a small distance to the stop in exchange for a measured-move target that's several times larger. The tight stop combined with the favorable risk-reward is what makes pipes particularly attractive for swing traders who can identify them on weekly charts.
This is a structural fact worth emphasizing. The reason is participation: a weekly candle reflects every market participant who acted during five trading days. Two adjacent weekly candles reaching the same extreme represents two full weeks of accumulated participation testing and rejecting the same level. The same pattern on a 5-minute chart represents only ten minutes of trading — much less structural significance. Students working on lower timeframes should still recognize pipes, but they should expect lower reliability and adjust position sizing accordingly.
Anatomy of a pipe bottom
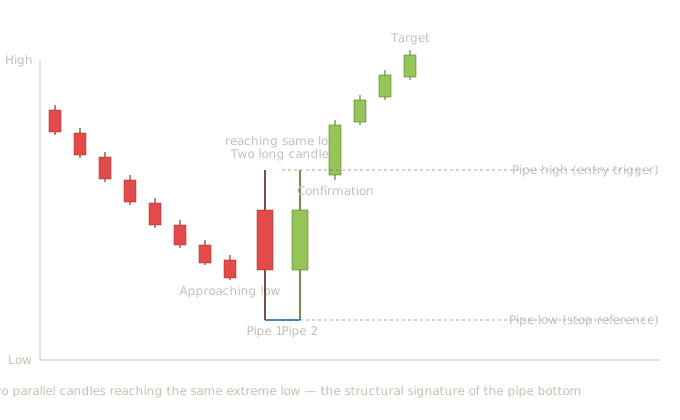
The pipe bottom is the bullish mirror of the pipe top. The structural narrative tells the same story inverted: an extended downtrend reaches a low, the market tests that low twice on adjacent candles, and the failed test produces a sharp reversal upward.
Eight bearish candles establish the prevailing downtrend with consistent moderate bodies. The trend context the pipe bottom will reverse. Each candle closes near its low, signaling steady seller control with progressive price discovery downward. The last lead-in candle is slightly smaller than the prior several — a hint that selling conviction may be fading as price approaches what will become the pipe's extreme.
A long bearish candle drives price to the eventual extreme low. Large body relative to the prior trend candles, close near the session's low, minimal lower shadow. This is what a final push of selling conviction looks like — sellers committing aggressively as price reaches what they expect to be a continuation breakdown level.
The structural signal. This candle opens near pipe 1's close and drops to test the same low — but instead of pushing meaningfully through, it gets rejected by buyers and closes substantially higher than its open. The result is a long bullish candle that reaches roughly the same extreme as pipe 1 but closes back up near the same high. The two candles together form the inverted pipe structure: parallel vertical extents reaching the same low, with one bearish body and one bullish body. The defining feature is the matched lows — both candles reach the same approximate extreme, with the second candle's failure to push lower revealing that sellers couldn't sustain the decline beyond pipe 1's low.
A long bullish candle opens near pipe 2's close and rallies decisively higher. The close is well above the higher of the two pipe candles' highs, providing structural confirmation that the reversal is real.
Three bullish candles drive price toward the measured-move target — the pipe's height projected upward from the confirmation candle's close.
Pattern statistics and sources
Confirmation rule: Decisive close below the lower of the two pipe candles' lows. Conservative entry waits for the close to be substantially below the pipe low; aggressive entry takes the confirmation candle's close. Volume signature: Volume should be heavy on both pipe candles, particularly the second candle showing the failed test of the high. Volume expansion on the confirmation candle strengthens the signal further. Reliability: Generally regarded as a strong performer on weekly charts with notably lower reliability on daily charts. Bulkowski specifically recommends the weekly timeframe for this pattern. Common failure mode: Price breaks above the matched highs after the apparent pipe formation, invalidating the pattern. Daily-chart pipes that lack the weekly-scale participation often produce more false signals than their weekly counterparts. Bulkowski's research on pipe tops is based on more than 4,000 perfect trades on the weekly scale. The pattern was discovered by Bulkowski in 1998 and is described as a good performer in both bull and bear markets, with particularly strong performance in bear markets when applied on the weekly scale. Bulkowski himself explicitly excluded pipes from some of his broader chart pattern comparison studies because pipes perform best on the weekly scale rather than the daily scale he used for his cross-pattern testing. This is an important methodological note: the optimal application of pipes requires weekly chart data, and reliability figures from daily-chart studies don't reflect the pattern's true edge. Bulkowski's published research on horn and pipe pattern variations (the family that includes pipe bottoms and pipe tops along with horn bottoms and horn tops) shows respectable performance with failure rates below 20%. Pipe bottoms specifically show an outstanding upside average rise of 47%.
Confirmation rule: Decisive close above the higher of the two pipe candles' highs. Volume signature: Mirror of pipe top — heavy volume on both pipe candles, particularly the second candle showing the failed test of the low. Reliability: Generally regarded as a strong performer on weekly charts. Bulkowski's research places it as the third-ranked pattern of three in his weekly-scale studies, but with a small break-even failure rate and high average rise — meaning the pattern performs well in absolute terms even if ranked lower relative to other weekly patterns. Common failure mode: Price breaks below the matched lows after the apparent pipe formation, invalidating the pattern. Bulkowski's research on pipe bottoms is based on more than 8,800 perfect trades on the weekly scale. The pattern was discovered by Bulkowski in 1998 and is described as an okay performer in a bull market when measured on the weekly scale, with a small break-even failure rate and high average rise. Overall performance rank is 3 of 3 on the weekly scale — last in comparison to other weekly patterns, but with strong absolute performance. ATAS' analysis of pipe patterns reports the pattern shows the best results on weekly charts, with a failure rate of about 18% on daily charts. In Bulkowski's overall rating, the pipe bottom takes second place in bull markets and third place in bear markets. Strike Money's analysis cites a 2022 study by the Trading Strategy Institute titled "Effective Trading Strategies: Pipe Bottom Patterns" demonstrating that traders using the pipe bottom strategy with strict risk management saw a 28% increase in profitability.
The statistics for pipe patterns illustrate several important methodological points students need to understand: Timeframe selection dramatically affects reliability. This is more pronounced for pipes than for almost any other pattern in the curriculum. Bulkowski explicitly recommends weekly charts and excluded pipes from some of his daily-chart studies because the daily-scale results don't reflect the pattern's true edge. A failure rate of 18% on daily charts versus stronger performance on weekly charts shows the magnitude of this timeframe effect. For your students, this means: pipes are a swing trader's and position trader's pattern more than a day trader's pattern. A trader looking at one-minute charts will see "pipes" constantly but they won't perform like the published statistics suggest. A trader looking at weekly charts will see pipes much less frequently but those formations will perform closer to published reliability figures. The trade-off between frequency and reliability is more extreme for pipes than for most patterns. Bulkowski's research dominates the published statistics. Because Bulkowski discovered and named the pattern in 1998, most published statistics derive from his testing. Independent verification across multiple methodologies is more limited than for established patterns like head and shoulders. This isn't a reason to dismiss the pattern — Bulkowski's testing is rigorous and his sample sizes are substantial (8,800+ pipe bottom trades, 4,000+ pipe top trades) — but students should recognize that they're working with a single research methodology rather than a cross-source pool. The "performance rank of 3 of 3" needs context. Bulkowski's pipe bottom ranking is last among the three patterns he tested at the weekly scale — but that ranking is relative, not absolute. The pattern still has a small break-even failure rate and high average rise. Students should not interpret the ranking as meaning the pipe bottom is unreliable; it means that two other patterns happen to perform slightly better on the weekly scale in Bulkowski's testing methodology. For your students, the practical takeaway: pipes are real patterns with strong absolute performance, particularly on weekly charts. Students working on lower timeframes should expect lower reliability and should treat pipes as one input among many rather than as standalone trade triggers. Students working on weekly charts (swing traders and position traders) will find pipes among the more attractive patterns in their toolkit because of the combination of high reliability, tight stop placement, and large average moves.
thepatternsite.com (Bulkowski) — the primary source for pipe pattern research, with separate entries for pipe tops and pipe bottoms including reliability figures, average post-breakout moves, and pull-back/throwback frequencies. As the pattern's discoverer, Bulkowski's site is the definitive reference. Bulkowski's Encyclopedia of Chart Patterns — pages 550-562 in the Second Edition cover the pipe patterns in detail. FXCM Markets articles on pipe patterns — accessible coverage of the patterns with practical trading application discussion. ATAS analysis of chart patterns — includes pipe pattern coverage with comparison rankings. Strike Money — references additional studies including the 2022 Trading Strategy Institute study. Marketclutch — covers Bulkowski's methodology more broadly with discussion of how to apply his research systematically.
Combined chart — pipe bottom into ascending triangle into cup and handle
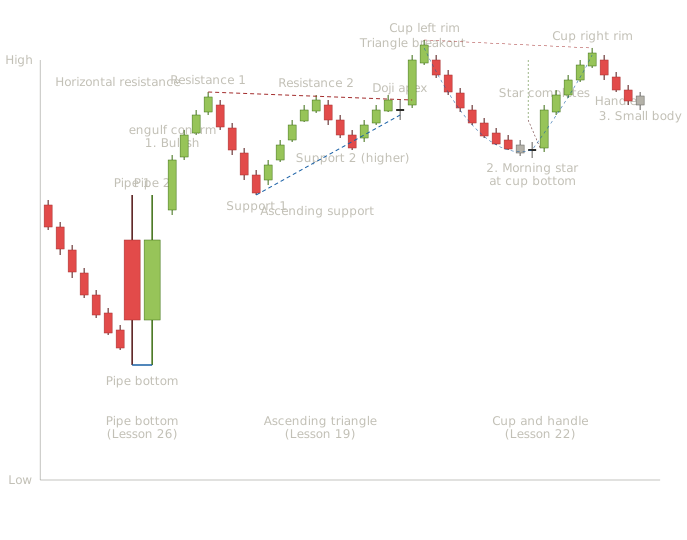
This is a particularly interesting combination because it spans three completely different structural pattern types: a converging consolidation (triangle), a curved hybrid pattern (cup and handle), and a sharp two-candle reversal (pipe). Real markets do produce these combinations — the chart shows a pipe bottom launching an uptrend, an ascending triangle as the trend's continuation pause, and a cup and handle that develops after the triangle's breakout fails to follow through cleanly. At least three named candle patterns from earlier lessons appear at structural moments.
Combined chart — double bottom into falling wedge into broadening top
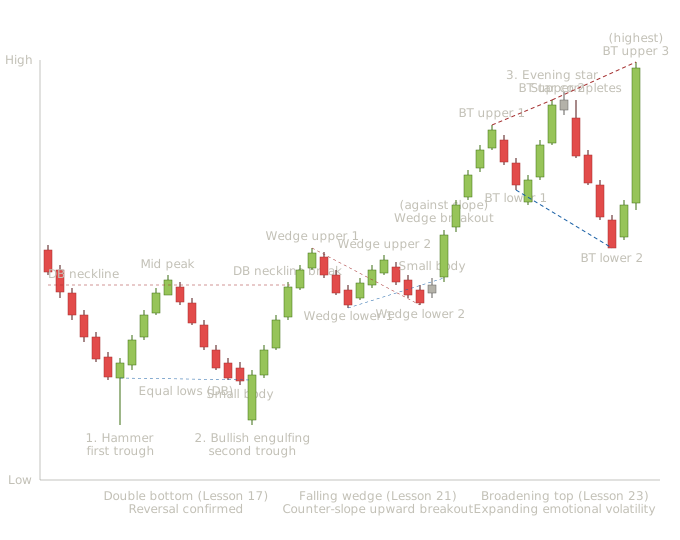
This sequence walks students through a complete trend cycle with each phase teaching a different reading skill. The double bottom shows a clean structural reversal with two named candle confirmations. The falling wedge shows the counter-slope resolution that's one of the trickiest patterns in the curriculum — both trendlines slope downward but the pattern resolves upward. The broadening top shows escalating emotional volatility producing a reversal at the third progressively higher peak.
Six bearish candles drive price down with consistent moderate bodies, establishing the prior downtrend that the double bottom will reverse. The body sizes are consistent throughout, signaling sustainable bearish trend rather than capitulation — exactly the kind of context where a rounding-style or two-touch reversal is structurally meaningful.
Small bullish body sitting near the top of an extended lower shadow at the bottom of the downtrend. From Lesson 3, this is the canonical hammer reversal candle. The four-dimension framework reads well: extended prior downtrend provides good location, the long lower shadow provides meaningful magnitude, and the close near the top of the range shows real buyer absorption of the selling pressure. A trader watching only candle patterns sees this as a tradeable reversal signal in its own right. The chart-level reader doesn't yet know this is part of a double bottom — at this point, it's just a hammer that might or might not lead to a sustained reversal.
Four bullish candles drive price up toward what will become the neckline level. The bodies are healthy moderate sizes, showing real buyer participation in the recovery. From a candle-level view, the hammer's signal is being validated by sustained follow-through. The rally pauses with a small bullish body, defining the first peak between the two troughs. This level becomes the structural marker for what will become the double bottom's neckline.
Five bearish candles drive price back down to retest the prior low. The candles get progressively smaller as the decline approaches the prior trough — fading bearish conviction approaching known support. From the body-trajectory reading habit established throughout the curriculum, this shrinking signals that the selling pressure is exhausting before it can break through the prior low. A very small bearish body shows seller exhaustion immediately preceding the structural support level. The market has spent its bearish energy and is poised for a reversal candle.
A long bullish candle opens below the prior small bearish candle's close and rallies powerfully to engulf its body completely. From Lesson 5, this is the bullish engulfing pattern at ideal location — at the prior trough's level, completing the double bottom's second touch of support with decisive candle confirmation. The candle-level reader sees a powerful reversal signal in its own right; the chart-level reader sees the second trough of the double bottom completing with decisive candle confirmation. Both views agree, and the agreement at the second trough is one of the highest-conviction entry signals in the curriculum. Multiple dimensions of analysis pointing at the same conclusion simultaneously.
Three large bullish candles drive price decisively above the prior neckline resistance. The breakout candle (candle 21) is particularly large with a near-marubozu structure. From Lesson 2, this is the high-quality breakout candle that confirms the double bottom's structural resolution. Two more bullish candles continue the rally into what becomes the first structural high of the falling wedge.
What follows is a falling wedge formation — both trendlines slope downward but the lower trendline slopes down less steeply than the upper trendline, creating the converging structure that defines the wedge. The successive highs and lows are each lower than the prior ones, but the lows are falling more slowly than the highs, producing the convergence. The candle character within the falling wedge is the critical reading. Notice that the bearish candles within the wedge get progressively smaller as the formation progresses — fading bearish conviction even as price makes successive lower highs. This is the canonical candle-body trajectory of a falling wedge: each successive decline produces less selling force, signaling that the apparent downtrend is structurally exhausted despite the lower highs. Students who haven't internalized Lesson 21's reading habits often misread the falling wedge as continued bearish action — they see the lower highs and lower lows and expect the trend to continue downward. The candle-body trajectory tells the integrated reader something different: the selling pressure is exhausting even as price makes new lows, and the wedge is approaching its structural resolution against its slope direction.
A tiny indecision body appears near the wedge's apex region. From Lesson 4, this small body shows the consolidation has reached its equilibrium point — neither side has the momentum to continue the prior pattern, and the next session's direction will be decisive.
A long bullish near-marubozu breaks decisively above the wedge's upper trendline. The body is dramatically larger than the recent compressed candles within the wedge. This is the counter-slope resolution that defines falling wedge behavior: despite both trendlines sloping downward, the pattern breaks upward because the structural compression made the breakout inevitable. The integrated reading at this moment is particularly important pedagogically. A trader watching only the wedge structure might have been considering the downside breakdown that the apparent bearish trend suggested. A trader watching the candle-body shrinkage knew the bearish pressure was fading. A trader watching the combined signal — wedge structure plus body trajectory plus the small-body equilibrium just before the breakout — entered long with high conviction at exactly the right moment.
Four bullish candles continue the uptrend with healthy moderate-to-large bodies. The market has resumed its bullish trend after the falling wedge's counter-slope resolution.
Four bearish candles drive price down to broadening top lower 1. The decline is moderate — bodies similar in size to the trend candles, suggesting normal pullback rather than aggressive selling.
Three large bullish candles drive price to a higher high than upper 1. Notice the bodies are larger than the bodies of the candles during the rally to upper 1. From Lesson 23, this body growth signals escalating emotional buying — the first warning sign that broadening pattern dynamics are emerging.
Look at the three-candle sequence carefully: the long bullish candle making the upper 2 high (candle 43), then a small spinning top showing indecision at the high (candle 44), then a long bearish candle that drops back into the bullish candle's body (candle 45). From Lesson 7, that's the textbook evening star pattern — bullish-then-indecision-then-bearish, with the third candle pushing decisively back into the first candle's body. The evening star at broadening top upper 2 provides exactly the kind of multi-layer signal that gives experienced traders conviction. The chart pattern reader sees a developing broadening structure with the second oscillation higher than the first; the candle pattern reader sees an evening star reversal signal at extended-rally location with strong magnitude; the integrated reader sees both layers agreeing that the rally is exhausting. The signal at upper 2 is tradeable in its own right — aggressive short entry on the evening star with a stop above the upper 2 high. But the broadening pattern's full development would require a third oscillation, so disciplined traders might wait to see whether the structure continues developing before committing fully.
Four bearish candles drive price to a lower low than lower 1. The bodies are larger than the bodies of the first decline — emotional selling matching the emotional buying. Both sides are increasing their participation, confirming the broadening pattern's structural identity.
Three bullish candles drive price to the highest high of the formation. The last candle is particularly long — a large bullish near-marubozu reaching the third progressively higher peak. This is the structural feature that defines broadening tops: three successively higher highs paired with successively lower lows, with the third extreme producing the strongest emotional push. The third peak with such a large bullish candle is the maximum-conviction moment for the bears. Two patterns just resolved bullishly (the double bottom and the falling wedge), but the broadening top's dynamics at this third extreme suggest the rally has finally exhausted itself. A trader watching only the long bullish candle at upper 3 might think the trend is accelerating; a trader watching the broadening pattern's structure sees the third oscillation reaching its extreme with maximum emotional participation, which is exactly when reversals typically occur.
Several pedagogical lessons compound across this sequence: Three named candle patterns at three structural chart pattern moments. The hammer at the first double-bottom trough, the bullish engulfing at the second double-bottom trough, and the evening star at the broadening top's upper 2 each serve as identifiable named patterns from earlier lessons appearing at exactly the structural moments where chart patterns predict they should. Students who can identify each of these named patterns can name what they're seeing rather than just describing abstract candle behavior. The falling wedge teaches counter-slope reading. Most students learning chart patterns expect breakouts to follow the prior trend direction. The falling wedge defies that expectation — both trendlines slope downward but the pattern resolves upward. Students who haven't internalized Lesson 21's reading habits will misread the wedge as continued bearish action and miss the eventual breakout. The body-shrinkage during the wedge's bearish candles and the small-body equilibrium just before the breakout are the candle-level signals that confirm the wedge's bullish bias is being validated. Body-trajectory reading transfers across all three patterns. The body-shrinkage we tracked at the first double-bottom trough's approach appeared again within the falling wedge's declining moves (fading bearish conviction during the apparent downtrend) and again at the broadening top through different dynamics (growing bodies on each successive rally, signaling escalating emotional participation rather than exhaustion). The same reading skill applies in different contexts with different implications, which is exactly the kind of pattern-recognition flexibility students should be developing by this point in the curriculum. The chart sequence shows a complete trend lifecycle. The double bottom establishes the trend's birth (reversal of a prior downtrend), the falling wedge marks a counter-trend consolidation that resolves against its slope (continuation of the established uptrend through a structurally tricky pattern), and the broadening top eventually reverses the trend through escalating emotional volatility. Students who can identify all three patterns and all three named candle signals on a single chart are reading at the level required for working trading.
A trader watching this chart in real time had multiple decision points across the sequence. Working through them shows how the integrated reading translates into specific trading decisions:
- At the hammer at the first double-bottom trough. Small long entry with stop below the hammer's low. The downtrend hasn't yet been confirmed as reversed — this is essentially a candle-pattern trade in a downtrend context, taken with reduced position size because of the structural uncertainty.
- At the bullish engulfing at the second double-bottom trough. Larger long entry or add-to-long for traders who entered at the hammer. The second trough's confirming candle pattern at the same level as the first trough confirms the support is real. The multi-layer signal at this moment gives higher conviction than either signal alone would.
- At the double bottom neckline breakout candle. Conservative long entry for traders who waited for full structural confirmation. The pattern has now completed structurally; price has broken above the prior resistance with a high-quality breakout candle.
- During the falling wedge formation. Most traders should not enter new long positions during the wedge's apparent downtrend — the structure looks bearish until the integrated reader recognizes the body-shrinkage signaling exhaustion. Traders already long from the double bottom can either hold through the wedge expecting the counter-slope resolution, or take partial profits and re-enter at the wedge breakout. Aggressive traders watching for the wedge's structural exhaustion might begin building long positions near the wedge lower 2 with tight stops below.
- At the wedge breakout candle. Long entry or re-entry for traders who took profits during the wedge. The counter-slope resolution has now confirmed structurally with a high-quality breakout candle.
- At the evening star at broadening top upper 2. Aggressive short entry with a stop above the upper 2 high. The broadening pattern hasn't yet developed its third oscillation, so disciplined traders might wait to confirm the pattern's full development — but the evening star itself is a tradeable signal in its own right at extended-rally location.
- At broadening top upper 3. The pattern has now developed three progressively higher highs and is at maximum extension. Short entry for traders who didn't take the evening star at upper 2, with stop above the upper 3 high. The third oscillation completing with a large bullish candle creates the structural setup for the reversal that the broadening pattern's dynamics predict.
A skilled trader doesn't need to take every entry. Choosing two or three high-conviction entries through the sequence based on personal risk tolerance is what most successful traders actually do. The integrated reading provides the framework to identify those high-conviction moments rather than relying on intuition.
By the time students can read this kind of three-pattern sequence with multiple named candle signals across the curriculum, they've developed the integrated analytical framework that working traders use. The specific habits that this chart reinforces: Multi-pattern sequences are normal, not exceptional. Real markets produce these chained patterns constantly. A trader who can only read one pattern at a time misses the larger structural narrative that the sequence tells. A trader who reads multi-pattern sequences sees the complete story of how a trend develops, consolidates, continues, and eventually reverses. Counter-slope patterns require special reading habits. Falling wedges resolve upward, rising wedges resolve downward. These patterns are responsible for many of the false reads that less-experienced traders make. The body-trajectory habits we've reinforced throughout the curriculum are what let students see the counter-slope resolution coming before it happens. Confluence between candle patterns and chart patterns provides the highest-conviction signals. The named candle patterns we've embedded at structural chart pattern moments — hammer at first trough, bullish engulfing at second trough, evening star at broadening peak — represent confluences between the two analytical systems. When both systems point at the same conclusion simultaneously, the resulting signal is materially stronger than either system alone would provide. Failures and counter-slope resolutions are as important as confirmations. Real markets produce patterns that resolve against expectations (like the falling wedge) as often as patterns that resolve as expected. Students who can read the counter-slope resolution as confidently as they read the standard resolution are reading at a working trader's level.
Common student mistakes with pipe patterns
This is the most important mistake to avoid. Pipes on daily charts have meaningfully lower reliability than pipes on weekly charts. Pipes on intraday charts have lower reliability still. Students should explicitly verify the timeframe before trading the pattern and adjust expectations accordingly. A pipe on a five-minute chart isn't the same trade as a pipe on a weekly chart, even though the visual structure looks identical.
Real pipes require both candles to reach approximately the same extreme. If one candle reaches notably higher (for pipe tops) or lower (for pipe bottoms) than the other, the visual impression of parallel pipes is broken. Students who treat any two adjacent candles as pipes will identify many false patterns. The structural requirement is the matched extremes, not just the adjacent long candles.
The two-candle structure isn't structurally complete on its own. Students who short the second pipe candle of a pipe top without waiting for the confirmation candle's close below the pipe's low take on significant risk. The confirmation candle is what validates the pipe as a genuine reversal rather than a temporary pause. Disciplined traders wait for the confirmation before treating the pattern as actionable.
Pipes are reversal patterns and require a clear prior trend to be valid. Two adjacent long candles in sideways action aren't a pipe — they're just two long candles at a resistance or support level being tested in a range. Without the prior uptrend (for pipe tops) or downtrend (for pipe bottoms), the structural significance that gives pipes their meaning is absent.
Tweezer tops (Lesson 6) and pipe tops both feature two candles reaching the same extreme. The structural distinction: tweezers can have any candle structure as long as the highs match (small bodies, doji-like, mixed colors); pipes specifically require both candles to be substantial long-bodied formations. Students should distinguish between the two because pipes have stricter identification requirements but stronger statistical performance when correctly identified.
Standard pipe tops feature one bullish candle (pipe 1, driving to the high) and one bearish candle (pipe 2, failing to push higher and reversing). Standard pipe bottoms feature one bearish candle and one bullish candle. Some sources accept variations where both pipe candles are the same color, but the standard pattern has the directional reversal in the candle color sequence. Students should verify the standard structure before identification.
The pipe pattern's measured-move calculation provides a target but not a guarantee. Just as with all chart patterns, the move may exceed the target, fall short of it, or behave erratically. Students should use the target as a planning reference and combine it with other risk management techniques rather than treating it as an inevitable destination.
How this lesson connects to what comes next
With Lesson 26 complete, the chart pattern vocabulary is now exhaustively covered. The curriculum includes:
Candle patterns (Lessons 1-13): Foundations, doji family, long-shadow singles, small-body candles, engulfing patterns, harami family, piercing/dark cloud, morning/evening stars, three soldiers/crows, three inside/outside up/down, continuation patterns, penetration spectrum, tweezers/abandoned baby, kickers/belt holds/windows.
Foundations of chart analysis (Lessons 14-15): Bridge from candles to chart patterns, support/resistance/trendlines.
Reversal chart patterns (Lessons 16-18, 24, 26): Head and shoulders, double tops/bottoms, rounding tops/bottoms, V-tops/V-bottoms, triple tops/bottoms, pipe tops/bottoms.
Continuation chart patterns (Lessons 19-21, 25): Triangles, flags/pennants, rectangles, wedges, scallops.
Hybrid and complex patterns (Lessons 22-23): Cup and handle, broadening patterns, diamonds, three drives, bump-and-run.
Lesson 27 builds the chart pattern interpretation framework — the parallel to Lesson 12 for candles. The framework formalizes the dimensions students have been applying throughout the chart pattern section: location quality, structural magnitude, volume confirmation, measured-move targets, failure modes, multi-timeframe context, and confluence with candle-level signals. After Lesson 27, students will have a systematic approach for evaluating any chart pattern they encounter.
Lesson 28 is the synthesis lesson where candle and chart analysis come together formally. The integrated reading we've been building throughout the curriculum gets laid out as a complete methodology students can apply systematically to any chart they look at.
Key Takeaways
- Pipe patterns are Thomas Bulkowski's discovery — sharp two-candle reversal patterns at the boundary between candle patterns and chart patterns, performing best on weekly charts.
- The defining feature is matched extremes: both candles must reach approximately the same high (pipe top) or low (pipe bottom), creating the visual impression of two parallel pipes standing side by side.
- Pipes differ from tweezer tops (Lesson 6) by requiring substantial long-bodied candles — the pattern is about the magnitude of the failed test, not just the test itself.
- The confirmation candle is essential: a third candle closing decisively beyond the pipe's lower boundary (pipe top) or upper boundary (pipe bottom) is required before the pattern is tradeable.
- The tight stop-loss advantage: stops sit just beyond the matched extremes, creating favorable risk-reward ratios of 1:3 or better compared to broader reversal patterns.
- Weekly chart preference is structural, not arbitrary: a weekly pipe represents two full weeks of accumulated market participation testing and rejecting the same level. The same pattern on a 5-minute chart represents only ten minutes of trading.
Quiz — 3 Questions
Answer one at a timeWhat is the critical structural distinction between a pipe top and a tweezer top (Lesson 6)?
In this lesson
300 — Western Chart Patterns — Structure, Candle Integration, Statistics