Broadening Patterns, Diamonds, Three Drives, and Bump-and-Run
This lesson covers four pattern families that appear less frequently than the patterns from Lessons 16-22 but recur often enough that students need to recognize them.
Introduction
This lesson covers four pattern families that appear less frequently than the patterns from Lessons 16-22 but recur often enough that students need to recognize them. Each represents a specific market psychology that the major patterns don't capture: broadening patterns reflect escalating emotional volatility, diamonds capture a two-phase transition from emotional expansion to exhausted contraction, three drives capture momentum-driven exhaustion through measurable extensions, and bump-and-run formations capture speculative blow-off tops.
These patterns share a common character that distinguishes them from the major formations: they require more interpretive judgment because their structural rules are less rigid. A double top is either there or it isn't — two peaks at the same level, intervening valley, neckline break. A broadening pattern is more impressionistic — diverging trendlines with multiple touches, but how much divergence and how many touches is a matter of degree. Students should treat these patterns as recognition opportunities rather than strict definitional categories.
Vocabulary
| Term | Definition |
|---|---|
| Broadening pattern (megaphone, expanding triangle) | A pattern bounded by two diverging trendlines. The upper line slopes upward connecting progressively higher highs; the lower line slopes downward connecting progressively lower lows. Price oscillations grow larger across the formation rather than smaller. The shape resembles a megaphone or inverted triangle when viewed across the full pattern. |
| Broadening top | A broadening pattern appearing at the end of an uptrend. Generally regarded as bearish because the expanding range signals escalating emotional volatility — fear of missing out drives larger buying excursions while panic drives larger selling excursions, and this kind of two-sided emotion typically precedes trend reversal rather than trend continuation. |
| Broadening bottom | A broadening pattern appearing at the end of a downtrend. The bullish mirror, with similar emotional volatility implications but typically signaling capitulation followed by recovery. |
| Right-angled broadening pattern | A broadening variant where one trendline is horizontal while the other slopes away. A right-angled broadening top has a flat upper resistance (horizontal upper line) with a falling lower support (sloping lower line). A right-angled broadening bottom is the mirror. |
| Diamond top | A complex pattern combining a broadening structure with a triangular structure. Price first traces a broadening pattern (diverging trendlines), then transitions into a contracting symmetrical triangle (converging trendlines). The combined shape resembles a diamond. Diamond tops are rare but generally regarded as reliable bearish reversal signals when properly identified. |
| Diamond bottom | The bullish mirror, appearing at downtrend ends. Even rarer than diamond tops, partly because the emotional dynamics that produce diamonds (expanding volatility followed by exhausted contraction) appear more commonly at tops than bottoms. |
| Three drives pattern | A reversal pattern with three sequential pushes in the same direction. Each push typically reaches an extreme at a Fibonacci extension level — 1.27 or 1.618 extensions of the prior swing. The third drive ending at exhaustion signals a high-probability reversal. The pattern overlaps with harmonic analysis, which is a separate technical tradition beyond the scope of this curriculum but worth mentioning so students know where to study further if interested. |
| Drive | One of the three pushes in the three drives pattern. Each drive consists of a directional move followed by a retracement that establishes the structural framework for the next drive. |
| Bump-and-run reversal (BARR) | A pattern capturing speculative blow-off tops or panic-driven bottoms. Price first advances at a steady angle for an extended period (the "lead-in phase"), then accelerates dramatically along a steeper angle (the "bump phase"), then breaks down through the original lead-in trendline (the "run phase" — the eventual decline that resolves the pattern). |
| Lead-in phase | The first phase of a bump-and-run, where price advances at a sustainable angle for an extended period. The trendline established during this phase becomes the pattern's structural reference point. |
| Bump phase | The acceleration phase where price moves at a steeper angle than the lead-in. The acceleration typically reflects speculative buying or fear-driven selling — emotional participation that exceeds what the underlying trend could sustain. |
| Run phase | The resolution phase where price breaks back through the original lead-in trendline, often with substantial follow-through as the speculative excess unwinds. |
| Pattern rarity | Each pattern in this lesson appears less frequently than the major patterns from earlier lessons. Students should recognize them when they appear but resist forcing identification on charts where the structural requirements aren't actually met. |
Anatomy of a broadening top with candle integration
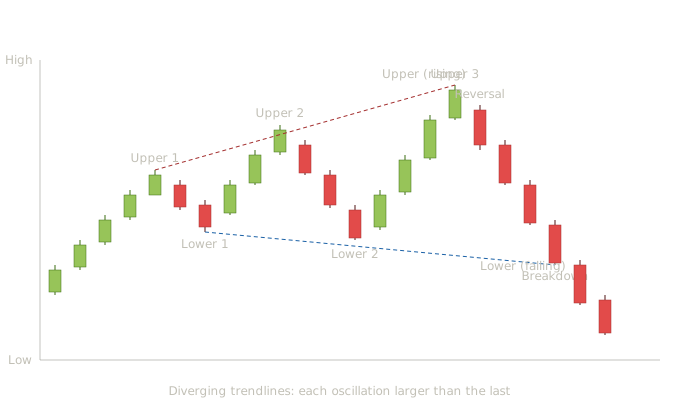
The broadening top captures a specific market psychology that students should learn to recognize: escalating emotional volatility. Where triangles compress price action through fading conviction on both sides, broadening patterns expand price action through growing emotion on both sides. The candle-level reading makes this dynamic visible session by session. The uptrend leading in (candles 1-5). Five bullish candles drive price up with consistent moderate bodies. Normal trend candles establishing the prior trend that will eventually reverse. Upper trendline touch 1 (candle 5). Price reaches its first significant high. The candle body is moderate — buyers are in control but not yet showing emotional excess. The first decline to lower trendline 1 (candles 6-7). Two moderate bearish candles drive price down. The decline is orderly with bodies similar in size to the prior trend candles. This is what a normal pullback within an extending trend looks like. Rally to upper trendline 2 (candles 8-10). Three bullish candles drive price to a new higher high. Now look at the candle bodies carefully: these bullish bodies are larger than the bodies during the original trend. This is the first warning that emotional buying is replacing rational accumulation. Each session covers more range than earlier sessions did. This is the critical candle-level reading for broadening patterns. Where triangle patterns show candle bodies shrinking as the consolidation progresses, broadening patterns show candle bodies growing. The escalating body sizes signal escalating emotional participation — fear of missing out drives larger buying excursions, panic drives larger selling excursions. The second decline to lower trendline 2 (candles 11-13). Three larger bearish candles drive price to a new lower low. The bearish bodies are also growing — emotional selling is matching emotional buying. Both sides are increasing their participation, and the oscillations are getting larger in both directions. Rally to upper trendline 3 (candles 14-16). Three more bullish candles drive price to yet another higher high. Notice these bullish bodies are larger still — the largest of any rally in the formation. The emotional buying is reaching its peak. This is the structural feature that defines broadening patterns: successive higher highs paired with successive lower lows, with growing candle bodies confirming the escalating emotional participation. The reversal candle at upper 3 (candle 17). A long bearish candle appears at the third peak. The body is large and decisive — sellers overwhelm buyers at this third extreme. From the candle-pattern reading, this is a strong bearish signal at structurally significant location: extended emotional rally has reached its third progressively higher peak, and the reversal candle confirms the exhaustion. The breakdown sequence (candles 18-21). Four long bearish candles drive price decisively below the lower trendline. The breakdown candle (candle 20) is particularly large, signaling the broadening pattern has resolved with conviction. Each successive bearish session is large-bodied — the same emotional dynamic that drove the formation now drives the resolution downward.
Escalating candle body sizes signal emotional rather than rational price discovery. Healthy trends produce candles of consistent moderate size as participants discover prices in an orderly manner. Broadening patterns produce candles of growing size as participants become increasingly emotional. The structural integrity that defines a sustainable trend erodes when both sides become emotional simultaneously. Two-sided emotion is structurally unstable. Trends can sustain extended periods of one-sided emotion — a strong uptrend may show emotional buying without much emotional selling, and the trend continues. What broadening patterns capture is the simultaneous escalation of emotion on both sides, which is structurally unstable because it produces increasingly wild oscillations that the underlying market can't sustain. The reversal typically occurs at the third extreme. Most identifiable broadening patterns produce their reversal at the third higher high (for broadening tops) or third lower low (for broadening bottoms). Patterns with only two oscillations are too tentative to call broadening; patterns with four or more oscillations are rare because the market typically can't sustain that many emotional extremes before something breaks. Right-angled broadening variants work similarly. A broadening pattern with one horizontal line and one sloping line follows the same emotional dynamic, just with the flat line representing a structural level that's being tested repeatedly while the other side shows expanding emotion. Right-angled broadening tops have a horizontal upper resistance with falling lower support — the resistance level holds while panic drives lower lows. Right-angled broadening bottoms are the mirror.
Anatomy of a diamond top
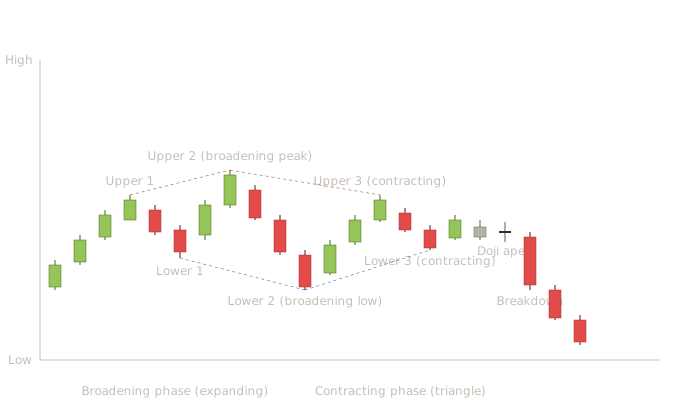
The diamond combines two pattern types students have already learned into a single setup that captures a specific two-phase market psychology. The pattern requires reading both halves separately before recognizing how they integrate. The uptrend leading in (candles 1-3). Three bullish candles establish the prevailing uptrend with moderate consistent bodies. Normal trend context. The broadening phase (candles 4-9). Two oscillations with expanding range trace the broadening half of the diamond. Upper 1 reaches a moderate high; Lower 1 reaches a moderate low. Upper 2 reaches a higher high than Upper 1; Lower 2 reaches a lower low than Lower 1. The candle bodies grow across this phase — escalating emotional participation as we covered in the broadening top section. By the end of the broadening phase, students should recognize that the pattern looks like a typical broadening top. At this point, without seeing what comes next, a student would expect a continuation of expanding oscillations or an eventual breakdown from the broadening pattern. The transition to contraction (candles 10-12). Three bullish candles rally from the broadening low toward what becomes Upper 3. Notice the candle bodies: they're smaller than the bodies during the broadening phase. The emotional buying has peaked and is now fading. Upper 3 (candle 12). The third peak forms at a level lower than Upper 2 — not higher, as it would be in a broadening pattern. This is the critical structural shift that distinguishes a diamond from a continuing broadening pattern. The rally fails to make a new high, signaling that the expansion phase is ending. The contracting phase (candles 13-15). Three bearish candles drive price down to Lower 3, which forms at a level higher than Lower 2. The pullback fails to reach a new low. Now both extremes are contracting — the structure has transitioned from expanding to converging. The triangle phase (candles 16-19). The contracting structure continues with candle bodies progressively shrinking. From Lesson 19's symmetrical triangle reading, this is exactly the canvas-not-signal canvas of a contracting consolidation. The pattern's right half resembles a small symmetrical triangle forming from the broadening pattern's resolution. The doji at the apex (candle 19). Maximum indecision as the contracting trendlines approach their meeting point. From Lessons 2 and 19, this is the canonical pre-breakout signal — the market can't sustain this level of indecision and one side will overwhelm the other in the next sessions. The breakdown candle (candle 20). A long bearish near-marubozu breaks decisively below the contracting lower trendline. The body is large relative to the compressed apex candles. This is the high-quality breakdown candle that confirms the diamond top's resolution. Continuation toward target (candles 21-22). Two more bearish candles drive price toward the measured-move target — typically calculated as the height of the diamond at its widest point (the broadening peak to broadening low) projected downward from the breakdown point.
The diamond captures a specific two-phase psychology that's worth understanding: Phase one: emotional expansion. The broadening half reflects the escalating volatility we covered earlier — fear of missing out drives larger buying, panic drives larger selling, both sides become emotional simultaneously. Phase two: emotional exhaustion. The contracting half reflects what happens after extreme emotion: both sides exhaust themselves. The market can't sustain repeated emotional extremes, so participants withdraw. The oscillations contract as exhausted buyers stop pushing for new highs and exhausted sellers stop pushing for new lows. The resolution direction matches the prior trend's exhaustion. Diamond tops resolve downward because the prior trend was upward and the emotional cycle (expansion followed by exhaustion) has exhausted that trend's buying capacity. Diamond bottoms work as the bullish mirror. The pattern is rare for structural reasons. Most broadening patterns simply break down through their expanding trendlines rather than transitioning into a contracting phase. The diamond requires both phases to develop fully, and the market often resolves earlier. Students should not force diamond identification when the contracting phase isn't clearly present — they'll be trading broadening patterns mislabeled as diamonds, which have different reliability characteristics.
Anatomy of three drives
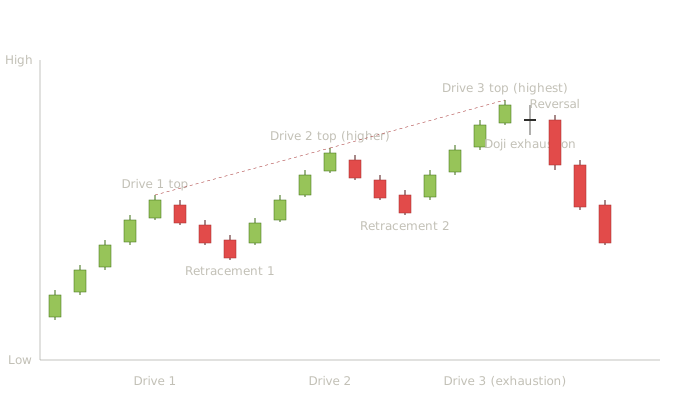
The three drives pattern captures momentum-driven exhaustion through three sequential pushes in the same direction. The pattern is structurally simpler than diamonds or broadening patterns — students just need to count drives and read the exhaustion signals at the third drive. Drive 1 (candles 1-5). Five bullish candles drive price to the first significant high. The drive consists of the directional move that establishes the pattern's starting baseline. Retracement 1 (candles 6-8). Three bearish candles produce an orderly pullback. The retracement's depth establishes one of the structural inputs that harmonic analysts use to calculate the next drive's expected extension level. Drive 2 (candles 9-12). Four bullish candles drive price to a higher high than drive 1. The bodies during drive 2 are similar in size to drive 1's bodies, signaling consistent buying conviction. Retracement 2 (candles 13-15). Three bearish candles produce a second orderly pullback. Similar in character to retracement 1. Drive 3 (candles 16-19). Four bullish candles drive price to the highest high of the pattern. The bodies during drive 3 are noticeable for what's happening to them — they're shrinking compared to drives 1 and 2. The candle-body trajectory shows fading buying conviction even as price reaches new highs. This is the key reading: each successive drive may reach a higher price level, but the bodies producing each drive are getting smaller. Students who watch only price see "trend still making new highs." Students who watch candle bodies see "each drive is weaker than the last." The body-reading habit is what tells students drive 3 is exhaustion rather than continuation. The doji at drive 3's top (candle 20). Indecision at the third extreme signals the pattern's resolution is imminent. The compression of energy across the three drives has reached the point where neither side can push further. The reversal candle (candle 21). A long bearish candle confirms the reversal. The body is large relative to the drive 3 candles — sellers overwhelm buyers decisively at this third extreme. Continuation lower (candles 22-23). Two more bearish candles drive price decisively lower, confirming the three drives pattern has resolved through reversal.
The pattern captures momentum exhaustion through repetition. Markets often run on momentum where each push produces another push without much rest. The three drives pattern captures the moment when this momentum exhausts itself — three pushes is typically what the market can sustain before participants have committed all the capital and emotional energy they have available. The pattern overlaps with harmonic analysis. Harmonic analysts use Fibonacci extension ratios (1.27, 1.618, 2.0) to calculate where each drive should top out. Three drives with each drive reaching the expected extension level become higher-probability setups in harmonic methodology. Students interested in this deeper level of analysis should study harmonic patterns separately — the field includes patterns like Gartleys, butterflies, bats, and crabs that build on the three drives foundation. Without harmonic analysis, the three drives is still useful as a reversal pattern. Even students who don't pursue harmonic methodology can use three drives as a recognition signal: three sequential pushes in the same direction with progressively weaker candle bodies signal momentum exhaustion regardless of whether the extensions hit specific Fibonacci levels.
Anatomy of a bump-and-run reversal
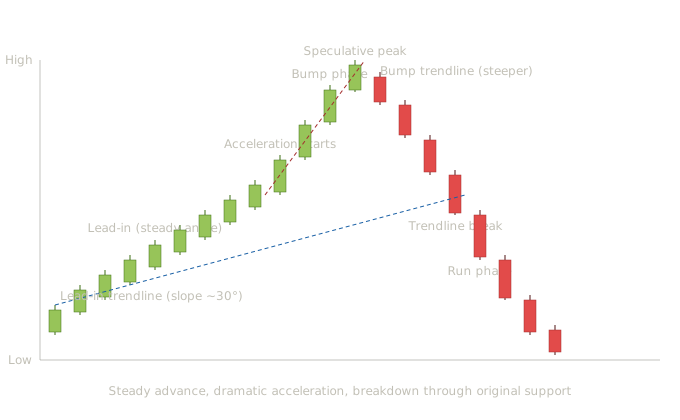
The bump-and-run captures one of the most dramatic patterns in technical analysis: the speculative blow-off. The pattern's three phases tell a complete story of how an orderly trend transforms into a speculative excess and then collapses back through its own structural support. The lead-in phase (candles 1-9). Nine bullish candles drive price up at a steady, sustainable angle. The candle bodies are consistent moderate sizes, the slope of the trendline beneath them is moderate (typically around 30 degrees according to the original pattern descriptions), and the progress is orderly. This is what a healthy uptrend looks like — participants are accumulating positions, the trend is sustainable, and the trendline could continue indefinitely. The lead-in phase needs to be substantial — typically at least a month on daily charts, often longer. A short lead-in doesn't establish enough structural foundation for the eventual breakdown to be significant. The acceleration begins (candles 10-12). Three bullish candles drive price up at a steeper angle than the lead-in. The candle bodies are larger now — each session covers more range than the lead-in sessions did. This is the transition from sustainable trend to speculative excess. Buyers are becoming aggressive in ways they weren't during the orderly phase. The bump phase (candles 13-14). Two more long bullish candles complete the dramatic acceleration. The slope of the bump trendline is markedly steeper than the lead-in trendline — typically at least 45 degrees, often steeper. Price is now moving at a pace that the underlying market fundamentals can't justify. The candle character during the bump phase is distinctive: very long bullish bodies with minimal upper shadows, near-marubozu structure, close near the high. This is what speculative buying looks like at the candle level — buyers aggressive throughout each session, no resistance from sellers, range expanding dramatically. The speculative peak (candle 14). Price reaches the bump's peak. From here on, the question is when (not whether) the speculative excess will unwind. The reversal candles (candles 15-17). Three long bearish candles drive price down from the peak. The bodies are large and decisive — the speculative buying has dried up and selling has taken over. Each session shows substantial range with sellers in control throughout. The trendline break (candle 18). A long bearish candle breaks decisively below the original lead-in trendline. This is the structural confirmation of the bump-and-run pattern. The slope that sustained the orderly trend has been violated, and the speculative excess that built up during the bump phase now collapses back below its own foundation. The run phase (candles 19-22). Four more long bearish candles drive price decisively lower. The decline often retraces much or all of the bump phase's gains because the buying that drove the bump was speculative rather than structural — the underlying fundamentals haven't changed, and price returns to levels that fundamentals can justify.
The pattern captures a specific speculative dynamic. Bump-and-runs typically appear in markets experiencing speculative bubbles — meme stocks during retail buying frenzies, crypto assets during mania phases, growth stocks during late-cycle euphoria, commodities during supply scares. The pattern is rare in normal markets but common in speculative environments. The two trendlines matter equally. The lead-in trendline establishes the structural support that the eventual breakdown must violate. The bump trendline confirms the speculative acceleration. Both are necessary for proper pattern identification. A steady advance without acceleration isn't a bump-and-run; it's just a trend. An acceleration without prior lead-in isn't a bump-and-run; it's just a vertical move. The breakdown typically produces substantial moves. Because the bump phase involved speculative excess that wasn't supported by fundamentals, the breakdown through the lead-in trendline often produces declines that retrace much of the bump phase. Students who recognize the pattern and act on the trendline break often capture significant moves. Bump-and-runs can occur at bottoms too. The bullish variant (bump-and-run reversal bottom) captures panic-driven declines. Lead-in phase descends at sustainable angle, bump phase accelerates downward (panic selling), then price breaks back above the lead-in trendline (the original support reversed into resistance, then broken through upward). The dynamics are identical in mirror — fear-driven excess that exhausts itself and reverses.
Pattern statistics and sources
Broadening top and broadening bottom
| Attribute | Notes |
|---|---|
| Confirmation rule | Decisive close beyond the appropriate diverging trendline, ideally with expanding volume. For broadening tops, breakdown through the lower trendline; for broadening bottoms, breakout through the upper trendline. |
| Volume signature | Expanding volume across the oscillations reflects escalating emotional participation. Volume should surge at the eventual breakdown or breakout. |
| Reliability | Generally regarded as a respected reversal pattern, particularly at the third oscillation extreme. Less commonly tested than the major patterns, so reliability figures vary more widely across sources. |
| Common failure mode | Pattern continues to expand beyond three oscillations rather than resolving. Resolution in the opposite direction of the expected reversal. |
Diamond top and diamond bottom
Cited statistics:
ChartGuys reports diamond tops with a downward break frequency of approximately 69%, a failure rate of about 10%, an average decline after breakdown of around 21%, pullback frequency of about 55%, and target met rate of approximately 65%. Diamond tops are considered reliable bearish reversal signals when properly identified, though not common.
ChartGuys reports diamond bottoms with an upward break frequency of approximately 73%, a failure rate of about 9%, an average rise after breakout of around 35%, throwback frequency of about 58%, and target met rate of approximately 67%. The diamond bottom is more reliable than its top counterpart, though it is rarer.
Bapital's algorithmic backtesting reports a diamond top pattern accuracy rate of 38% from 904 formations, and a diamond bottom accuracy rate of 41% from 1,052 formations. These algorithmic figures are substantially lower than manually-derived figures from other sources.
LiteFinance reports a Diamond pattern overall success rate of 81%, describing it as one of the most reliable and effective reversal formations. They note that symmetry is often the main indicator of pattern reliability — more symmetrical diamonds produce more reliable signals.
FxOpen cites Bulkowski's research showing diamond bottom patterns break upward about 73-74% of the time with an average rise of roughly 35-39% after breakout, while diamond tops break downward about 54% of the time with an average decline of around 17%.
Bump-and-run reversal
Bulkowski's research on the bump-and-run reversal bottom shows it as a strong performer in both bull and bear markets, with a low break-even failure rate and high average rise after breakout. If traders wait for the breakout confirmation, the failure rate drops from 19% to 9%. The average gain is 37%, with the most likely rise at 20%.
Three drives pattern
Reliable statistical data on three drives is more difficult to find because the pattern overlaps significantly with harmonic analysis and is typically tested within that broader framework rather than as a standalone pattern. Students interested in three drives reliability should look into harmonic pattern research, particularly Scott Carney's work and the broader harmonic trading literature.
What the spread teaches
The statistics for these rarer patterns show typical methodology-driven variance, but with an additional twist: the patterns appear less frequently than major patterns, so sample sizes in backtests are typically smaller than for head and shoulders or double tops. The diamond top reliability ranging from 38% (Bapital's algorithmic detection of 904 patterns) to 81% (LiteFinance's overall figure) illustrates the same manual-versus-algorithmic gap we've seen throughout the curriculum. Manual detection by experienced analysts produces higher reliability figures because human judgment filters out patterns that don't quite work before counting them. Algorithmic detection produces lower reliability figures because the rules are applied uniformly to every candidate. For your students, the practical takeaway with these rarer patterns: they're real patterns with real edges when properly identified, but the identification standards matter even more than for major patterns. The major patterns have such established structural rules that misidentification is less common. The rarer patterns have looser structural definitions, so the trader's judgment in distinguishing valid from invalid examples drives outcomes significantly.
Multi-source pool
For students who want to dig deeper into these rarer pattern statistics:
- thepatternsite.com (Bulkowski) — research on all four pattern families, including the bump-and-run reversal which Bulkowski discovered in 1999.
- chartguys.com — accessible figures for diamond patterns with specific reliability metrics.
- bapital.com — algorithmic backtesting providing counterweight to manually-derived figures.
- litefinance.org — review-style summaries with comparative figures.
- nordfx.com — diamond pattern analysis with structural focus.
- fxopen.com — recent research aggregation referencing Bulkowski.
- For three drives specifically: Scott Carney's The Harmonic Trader and his pattern site, plus broader harmonic pattern research via Google Scholar searches for "harmonic pattern trading" and "Fibonacci extension reversal."
- Academic literature via Google Scholar — search "broadening pattern technical analysis," "diamond chart pattern," or "speculative bubble technical analysis."
Common student mistakes with these rare patterns
This is the universal mistake with rare patterns. Students who've just learned about diamonds see diamond shapes everywhere; students who've just learned about broadening patterns see expanding ranges everywhere. The discipline is to require the specific structural rules — for broadening, multiple touches on diverging trendlines with escalating candle bodies; for diamonds, distinct broadening phase followed by distinct contracting phase; for three drives, three sequential pushes with clear retracements between them; for bump-and-run, substantial lead-in phase followed by clear acceleration followed by trendline break.
Channels have parallel lines; broadening patterns have diverging lines. The structural distinction matters because channel expansion (a channel that's widening over time) often signals continuation, while broadening pattern emerges from emotional participation that typically precedes reversal.
Three drives requires three distinct pushes with measurable retracements between them. Not every series of moves in the same direction qualifies. Students should specifically count drives carefully and verify each one has a clear high (or low) followed by a clear retracement before the next drive begins.
Real bump-and-runs require a substantial lead-in phase of sustainable angle followed by clear acceleration followed by eventual breakdown through the original trendline. A trend that simply accelerates and continues isn't a bump-and-run; it's just an accelerating trend. The breakdown through the original lead-in trendline is the structural requirement that confirms the pattern.
Diamond tops can resemble head and shoulders patterns when viewed casually — both involve a peak with structures on either side. The structural distinction: head and shoulders have three distinct peaks at different levels with a clear neckline; diamonds have a broadening structure followed by a contracting structure with no necessary three-peak count. Students should verify which pattern they're looking at before applying its specific rules.
Because these patterns appear infrequently, students who recognize one are often eager to trade it. The discipline is the same as for major patterns: wait for structural confirmation (the breakdown or breakout candle), evaluate breakout candle quality, look for volume confirmation, and consider broader market context. Rare patterns don't get special treatment that allows skipping confirmation requirements.
How this lesson connects to what comes next
With Lesson 23 complete, the full Western chart pattern vocabulary is built. Students have:
- Reversal patterns (Lessons 16-18): Head and shoulders, double tops and bottoms, rounding tops and bottoms, V-tops and V-bottoms.
- Continuation patterns (Lessons 19-21): Triangles (symmetrical, ascending, descending), flags and pennants, rectangles, rising and falling wedges.
- Hybrid pattern (Lesson 22): Cup and handle and inverse cup and handle.
- Rare patterns (Lesson 23): Broadening patterns (top and bottom, including right-angled variants), diamond top and diamond bottom, three drives, bump-and-run reversal.
Lesson 24 builds the chart pattern interpretation framework — the parallel to Lesson 12 for candles. The framework formalizes the dimensions students have been applying throughout the chart pattern section: location quality, structural magnitude, volume confirmation, measured-move targets, failure modes, multi-timeframe context, and confluence with candle-level signals. After Lesson 24, students will have a systematic approach for evaluating any chart pattern they encounter rather than just applying memorized rules.
Lesson 25 is the synthesis lesson where candle and chart analysis come together formally. The integrated reading we've been building throughout the curriculum gets laid out as a complete methodology students can apply systematically to any chart they look at.
Quiz — 3 Questions
Answer one at a timeThe lesson distinguishes broadening patterns from symmetrical triangles as structural opposites. A student looks at a chart and sees price oscillations growing larger over time, with each rally reaching a higher high and each pullback reaching a lower low. Which pattern does this describe, and how does the candle behavior differ from a symmetrical triangle?
In this lesson
300 — Western Chart Patterns — Structure, Candle Integration, Statistics