Rectangles and Wedges
This lesson covers two pattern families that share a common structural feature with the triangles from Lesson 19 but resolve differently. Rectangles are sideways consolidations bounded by horizontal trendlines — neither sloping line, just parallel resistance and support. Wedges are angled consolidations where both trendlines slope in the same direction — both rising or both falling — making them structurally distinct from symmetrical triangles where the lines slope toward each other.
Rectangles and Wedges
This lesson covers two pattern families that share a common structural feature with the triangles from Lesson 19 but resolve differently. Rectangles are sideways consolidations bounded by horizontal trendlines — neither sloping line, just parallel resistance and support. Wedges are angled consolidations where both trendlines slope in the same direction — both rising or both falling — making them structurally distinct from symmetrical triangles where the lines slope toward each other.
Wedges are particularly important to teach carefully because they produce one of the more counterintuitive resolutions in chart pattern analysis. A rising wedge typically resolves downward, against its slope direction. A falling wedge typically resolves upward, also against its slope direction. Students who haven't internalized this property will misread wedges as trend continuations and trade them in the wrong direction.
Vocabulary
| Term | Definition |
|---|---|
| Rectangle | A consolidation pattern bounded by a horizontal upper resistance line and a horizontal lower support line. Price oscillates between the two boundaries with multiple touches on each side. The pattern represents a balanced standoff between buyers and sellers at specific levels, with neither side gaining ground. Resolution occurs when one side overwhelms the other and price breaks through one of the horizontal boundaries. |
| Trading range | A common synonym for rectangle, particularly when referring to the broader market structure rather than the specific charting pattern. The terms are often used interchangeably; trading range emphasizes the functional behavior (price ranging between two levels) while rectangle emphasizes the visual structure. |
| Bullish rectangle | A rectangle appearing within an uptrend, generally regarded as a continuation pattern. The trend's prior direction biases the eventual resolution upward, though the bias isn't a guarantee — rectangles can resolve in either direction regardless of their position within a trend. |
| Bearish rectangle | A rectangle appearing within a downtrend, generally regarded as a continuation pattern with a downward bias toward resolution. |
| Rising wedge | A pattern bounded by two ascending trendlines that converge as price moves higher. The upper line connects rising highs; the lower line connects rising lows that rise faster than the highs do. The structure traces a narrowing channel pointing upward. Despite the upward slope, rising wedges are generally regarded as bearish — they typically resolve through a breakdown below the lower trendline rather than continuing upward. |
| Falling wedge | The mirror. Two descending trendlines that converge as price moves lower. The lower line connects falling lows; the upper line connects falling highs that fall faster than the lows do. The structure traces a narrowing channel pointing downward. Despite the downward slope, falling wedges are generally regarded as bullish — they typically resolve through a breakout above the upper trendline rather than continuing lower. |
| Slope convergence | The structural feature that distinguishes wedges from channels. In a channel, the two parallel trendlines run at the same angle and never converge. In a wedge, both lines slope in the same direction but at different angles, causing them to converge. The convergence point is the apex, similar to triangle apexes. |
| Counter-slope resolution | The defining behavior of wedge patterns. Rising wedges resolve downward; falling wedges resolve upward. This counterintuitive property is what makes wedges structurally different from triangles, flags, or other continuation patterns where breakout direction generally follows the prior trend. |
| Bearish bias of rising wedges | The structural reason rising wedges resolve downward. As the wedge narrows, the rising lower trendline catches up to the rising upper trendline. The closing gap means buyers need progressively less follow-through to maintain the structure. Once buyers can't maintain even minimal follow-through, the structure breaks down through the lower trendline. |
| Bullish bias of falling wedges | The mirror reasoning. As a falling wedge narrows, the falling upper trendline catches down to the falling lower trendline. The closing gap means sellers need progressively less follow-through to maintain the structure. Once sellers can't maintain even minimal follow-through, the structure breaks up through the upper trendline. |
Anatomy of a rectangle with candle integration
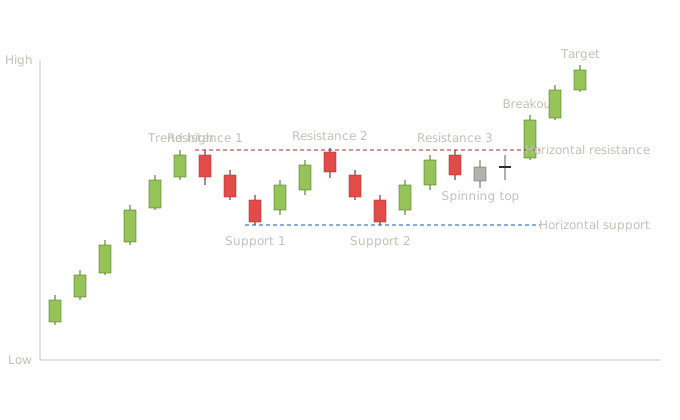
The rectangle is structurally the simplest continuation pattern — two horizontal lines containing price action with multiple touches at each boundary. The teaching value lies in the candle behavior within the structure and what specific candles tell students about when resolution is approaching. The uptrend leading in (candles 1-6). Six bullish candles drive price up with consistent moderate bodies. This is the prevailing trend the rectangle will eventually continue. Without this prior uptrend, the formation that follows would just be sideways action with no continuation expectation. The first touch of resistance (candle 7). Price reaches what will become the upper boundary and reverses. The candle at the high is a moderate bearish session — buyers couldn't push higher, and sellers responded. At this point students see only "uptrend hit a high; pulled back." There's no rectangle yet. The decline to the first support touch (candles 8-9). Two bearish candles drive price down to the level that will become the lower boundary. The decline is orderly, not panicked — moderate bodies, normal proportions. This is what a healthy first pullback within a developing rectangle looks like. Support holds (candle 9). Price reaches the support level and reverses. The candle structure here shows buyers stepping in — close above open, body sitting near the top of the range. The first support touch is established. Rally back to resistance 2 (candles 10-12). Three candles drive price back up to test the same upper level that rejected it before. The fact that buyers can push back to the same resistance suggests the rectangle structure is real rather than transient. Resistance rejects again (candle 12). Another bearish session at the resistance level confirms the second touch. Now students have a horizontal level being tested twice — that's enough to draw the upper boundary with confidence. Decline to support 2 (candles 13-15). Three bearish candles drive price back down. Again the decline is orderly. Notice how the candle character within the rectangle is fundamentally different from the candle character during the prior uptrend — moderate bodies in both directions, no clear directional bias, alternating colors. This is the canvas of a healthy consolidation. Support holds again (candle 15). Price reaches the support level and reverses upward again. Two confirmed touches of resistance and two confirmed touches of support — the rectangle is now identified. The third rally and rejection (candles 16-18). Three more candles drive price back up to resistance, with the third candle rejecting at the same level a third time. By the third touch of either boundary, the level is well-established and other market participants are clearly watching it. The spinning top and doji (candles 19-20). As the consolidation approaches what will become the breakout, two indecisive candles appear near the upper boundary. From Lessons 2 and 4, these are spinning tops and dojis — sessions where neither side won decisively. The appearance of indecision candles near resistance, rather than further selling rejections, is a subtle but important shift. Sellers aren't pushing price back down to support anymore; they're just holding the line. When sellers can no longer push price away from resistance, the structural integrity of the rectangle is eroding. The breakout candle (candle 21). A long bullish near-marubozu breaks decisively above the resistance level. The body is large relative to the rectangle's candles, the close is well above the breakout level. From Lesson 2, this is the high-quality breakout candle that confirms the rectangle's resolution upward. Continuation toward target (candles 22-23). Two more bullish candles drive price toward the measured-move target. The measured move for a rectangle is calculated by taking the rectangle's height (the distance from support to resistance) and projecting that distance from the breakout point in the breakout direction.
The rectangle teaches a reading habit that's important for trading consolidations: Watch the candle character near the boundaries as time passes. Early in a rectangle, the boundary touches are decisive — strong bearish candles reject at resistance, strong bullish candles bounce off support. Later in the rectangle, the candle character often shifts toward indecision near one of the boundaries. When indecision candles appear near a boundary that previously rejected price decisively, the structural integrity of that boundary is weakening. The breakout typically follows shortly after this character shift. The number of touches matters but isn't the whole story. Three touches on each boundary make a rectangle well-established, but a rectangle with five touches isn't necessarily stronger than one with three. What matters more than touch count is the candle character at each touch and the trend in candle behavior across the consolidation. A rectangle showing decisive rejections at every touch is healthy. A rectangle showing fading conviction at successive touches is approaching resolution. The breakout candle quality matters as much as in any other pattern. A weak breakout barely clearing the resistance level is suspect. A strong breakout with a long bullish body, minimal upper shadow, and close well above the boundary is much more trustworthy. Students should evaluate breakout candle structure before treating the resolution as confirmed.
Anatomy of a rising wedge with candle integration
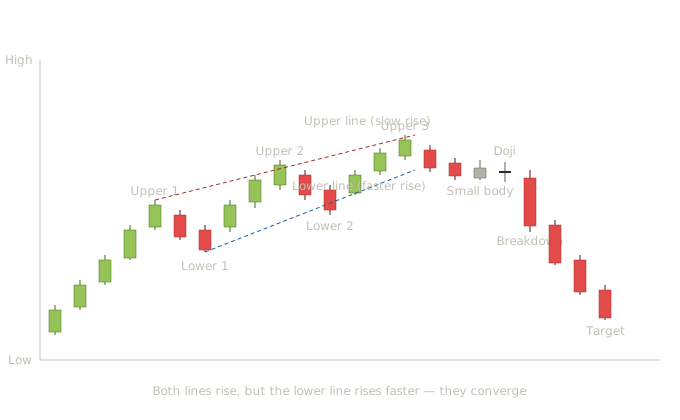
The rising wedge is the most pedagogically important pattern in this lesson because its resolution direction surprises students who don't understand the underlying mechanics. Both trendlines slope upward — at first glance the pattern looks bullish. But the rising wedge typically resolves downward, against its slope. Understanding why requires reading the candle character within the structure. The uptrend leading in (candles 1-4). Four bullish candles establish the prevailing uptrend with consistent moderate bodies. Each candle closes near its high, signaling healthy buyer control. Normal trend candles. Upper trendline touch 1 (candle 5). Price reaches what will become the upper boundary and stalls. The candle here is still bullish but smaller-bodied than the prior candles — a hint that the buying pressure is starting to fade. The pullback to lower trendline 1 (candles 6-7). Two bearish candles drive price down to the level that will become the lower boundary. Notice the candle character: these bearish bodies aren't large — they're moderate-sized counter-trend sessions. The pullback is contained, not aggressive. The rally to upper trendline 2 (candles 8-10). Three bullish candles drive price up to a higher level. The new high is higher than the prior upper trendline touch — buyers made marginal progress. But notice the candle bodies: they're smaller than the bodies from the original uptrend. The bullish conviction is fading even though the highs are still rising. The pullback to lower trendline 2 (candles 11-12). Two bearish candles drive price down. The pullback's low is higher than the prior pullback's low — but it's not much higher. The lower trendline is rising, but it's rising slowly compared to the upper trendline. This is the critical observation that makes rising wedges bearish: the lower trendline rises faster than the upper trendline does. Buyers can still push price to higher highs, but each pullback bottoms only slightly above the prior one. The structure is compressing toward the apex. The rally to upper trendline 3 (candles 13-15). Three bullish candles drive price to another marginal new high. Now look at the body sizes — these candles are noticeably smaller than the candles from the original uptrend or even from the rally to touch 2. The progression of fading bullish conviction is becoming clear at the candle level. The pullback decline (candles 16-17). Small bearish candles drive price down within the narrowing channel. The bearish bodies aren't large, but the bullish bodies aren't large either — neither side is making significant progress. The small-body candle and doji (candles 18-19). As the wedge nears its apex, indecision candles appear. The small-bodied candle followed by the doji signal that the compression has reached the point where neither side can sustain even modest progress. From the candle-pattern vocabulary, this is exactly the same indecision-near-apex pattern that appeared in symmetrical triangles in Lesson 19 — but the implications differ because of the wedge's structural bias. The breakdown candle (candle 20). A long bearish candle breaks decisively below the lower trendline. The body is large relative to the wedge's compressed candles, and the candle drops sharply against the wedge's upward slope direction. This is the counter-slope resolution that defines rising wedge behavior. The decline toward target (candles 21-23). Three more bearish candles drive price toward the measured-move target. For a rising wedge, the target is generally calculated as the height of the wedge at its widest point (the start of the formation) projected downward from the breakdown point.
The pattern's bearish bias comes from the underlying candle behavior, not arbitrary convention. As the wedge develops: The upper trendline rises slowly. Each new high is only marginally higher than the prior high. Buyers are running out of room to push. The lower trendline rises faster. Each pullback bottoms only slightly above the prior pullback. The narrowing means the structural support is getting closer to the rising resistance. The candle bodies shrink across the formation. Both bullish and bearish bodies get smaller as the wedge progresses, signaling fading conviction on both sides. Eventually one of two things happens: either buyers find the energy for one decisive push above the upper trendline (rare in proper rising wedges), or the lower trendline gets caught and breaks (the typical outcome). Because the lower trendline is rising faster than the upper, the structural pressure to break the lower line accumulates faster than the pressure to break the upper line. The candle-level reading captures this: when students see candle bodies shrinking inside a rising-sloped consolidation, they're watching buying pressure exhaust. The breakdown that follows isn't a surprise — it's the visible exhaustion completing.
A falling wedge has both trendlines descending, but the upper line descends faster than the lower line does. Sellers can still push to lower lows, but each rally tops only slightly below the prior one. The compression eventually breaks upward when sellers can no longer sustain even minimal new lows — the structural pressure to break the upper line accumulates faster than the pressure to break the lower line. The candle reading is the mirror: shrinking bodies inside a falling-sloped consolidation signal selling exhaustion. The breakout that follows is the visible exhaustion completing in the bullish direction.
Pattern statistics and sources
Rectangle (bullish or bearish)
| Attribute | Notes |
|---|---|
| Confirmation rule | Decisive close beyond one of the horizontal boundaries, ideally with expanding volume. Conservative entry waits for retest of the broken boundary; aggressive entry takes the breakout candle close. |
| Volume signature | Volume typically contracts as the rectangle develops with declining participation across multiple oscillations, then expands at the breakout to confirm new participation joining the resolution. |
| Reliability | Generally regarded as a moderately reliable continuation pattern, with reliability dependent on the prior trend's strength and the rectangle's volume signature. |
| Common failure mode | False breakout where price briefly crosses a boundary and returns into the rectangle. Resolution in the opposite direction of the prior trend (bullish rectangles breaking down rather than up). |
Multi-source pool for rectangle statistics: thepatternsite.com, liberatedstocktrader.com, quantifiedstrategies.com, luxalgo.com, and academic searches via Google Scholar using "rectangle chart pattern" or "trading range breakout" terms. Rectangles are sometimes folded into broader "consolidation" or "trading range" research rather than treated as a separate pattern, so students may need to search adjacent terms.
Rising wedge
| Attribute | Notes |
|---|---|
| Confirmation rule | Decisive close below the lower trendline, ideally with expanding volume. The breakdown candle should have a substantial bearish body. |
| Volume signature | Volume should decline progressively during the wedge's formation, reflecting fading conviction. Volume expansion at the breakdown confirms the resolution. |
| Reliability | Generally regarded as a respected bearish pattern when correctly identified, particularly in bull market contexts where the wedge marks intermediate-term reversals within larger uptrends. |
| Common failure mode | Pattern breaks upward against expected direction (occurs in roughly 40% of cases). False breakdown that recovers within a few sessions. |
Cited statistics:
LuxAlgo's research reports rising wedges with an 81% success rate in bull markets, with the pattern requiring at least three touches on both lines and a noticeable drop in trading volume to confirm.
A TradingView analysis of rising wedges reports an overall success rate of 81% in bull markets with average potential profit of 38% in existing uptrends. The breakout direction is bearish in 60% of cases and bullish in 40% of cases. Contextual reliability differs significantly — 81% success with 38% average gain in bull markets versus 51% success with only 9% average decline after a downtrend.
Colibri Trader's review notes a multi-year study finding rising wedges have an 81% success rate for bearish breakouts during bear markets, with the data confirming that trading in alignment with the broader market gives a meaningful statistical edge.
Falling wedge
| Attribute | Notes |
|---|---|
| Confirmation rule | Decisive close above the upper trendline, ideally with expanding volume. |
| Volume signature | Volume should decline progressively during formation, expand at breakout. |
| Reliability | Generally regarded as a respected bullish pattern, particularly in bull market contexts as a continuation signal or after extended declines as a reversal signal. |
| Common failure mode | Pattern breaks downward against expected direction. False breakout that recovers within a few sessions. |
Cited statistics:
LuxAlgo's research reports falling wedges with a 74% success rate during bull markets, with both wedge types offering average potential profits around 38%.
Multi-year testing referenced by Colibri Trader shows falling wedges leading to successful bullish breakouts about 74% of the time when they form in a bull market.
TradingSim reports falling wedges break upward approximately 68% of the time when confirmed with volume expansion on the breakout candle. Without volume confirmation, the win rate drops below 50%. The pattern is more reliable in trending markets than in choppy range-bound conditions.
Strike Money's analysis reports the falling wedge pattern has a 74% success rate in bull markets with average potential profit of 38%, while the rising wedge has an 81% success rate in bull markets with the same 38% average profit potential.
What the cited statistics teach
The wedge reliability figures cluster more tightly than for many other patterns — multiple sources land in the 68-81% range for the favored direction. This tighter clustering reflects a few things: wedges have stricter structural definitions (both lines must slope the same direction, with specific convergence requirements), so misidentification is less common; and the volume-confirmation requirement filters out lower-quality patterns more effectively than for some other formations. The teaching point worth emphasizing: the 81% success rate for rising wedges drops to 51% when the wedge appears after a downtrend rather than within a bull market context. This is a dramatic context-dependence — the same structural pattern is highly reliable in one market environment and barely better than chance in another. Students who internalize wedge patterns as "always work this way" miss the critical role of broader market context. The volume-confirmation effect from TradingSim — falling wedges break upward 68% of the time with volume confirmation but under 50% without — is another teaching point students need. The same pattern can be 68% reliable or worse than chance depending on a single confirmation factor. Students who skip volume reading lose access to the better-than-half edge that proper confirmation provides.
Multi-source pool
For students who want to dig deeper into wedge and rectangle statistics:
- thepatternsite.com (Bulkowski) — separate entries for rising wedges, falling wedges, and rectangles with reliability rankings, failure rates, and average post-breakout moves.
- luxalgo.com — research aggregation across multiple sources with comparative figures for both wedge variants.
- tradingsim.com — backtest figures with volume-confirmation filtering effects.
- strike.money — review-style summaries with multi-year testing references.
- colibritrader.com — multi-year study aggregation with market-context breakdowns.
- quantifiedstrategies.com — methodological commentary alongside backtest figures.
- Academic literature via Google Scholar — search "wedge chart pattern technical analysis" or "converging trendlines breakout."
Common student mistakes with rectangles and wedges
This is the single most common wedge mistake. Students see two ascending trendlines and assume the pattern is bullish because of the upward slope. The counter-slope resolution principle (rising wedges break down, falling wedges break up) needs to be drilled until students automatically check wedge direction against expected resolution before placing trades.
A channel has two parallel trendlines; a wedge has two converging trendlines. Both patterns can have upward or downward slopes, so slope direction alone isn't enough to distinguish them. The key check is whether the trendlines are parallel (channel — typically a continuation pattern) or converging (wedge — typically resolves counter-slope).
Rectangles in established uptrends are generally regarded as continuation patterns with a bullish bias toward eventual resolution. Students who short the rectangle's lower boundary expecting a reversal often get caught when the rectangle resolves upward in line with the prior trend. The prior trend's direction should be the default assumption for resolution direction unless specific evidence suggests otherwise.
Wedges need multiple touches on both lines before the structure is identifiable — typically at least three touches on each line. Patterns with only two touches on each line are tentative wedges that may or may not develop into full patterns. Students who trade tentative wedges often discover the pattern they were trading wasn't actually a wedge at all.
Volume confirmation matters significantly for both rectangles and wedges. Patterns with declining volume during formation and expanding volume at breakout are far more reliable than patterns with erratic or rising volume throughout. The TradingSim data showing falling wedges drop from 68% to under 50% reliability without volume confirmation should make this concrete for students.
The candle that breaks the pattern should be decisive — large body, minimal counter-direction shadow, close well beyond the trendline. A small-bodied candle barely crossing a boundary is suspect and often becomes a false breakout. Breakout candle quality is the final filter students should apply before treating a pattern as confirmed.
Students sometimes draw wedges where the trendlines are nearly parallel and convince themselves they have a wedge when they actually have a channel. Real wedges show clear convergence — the trendlines visibly approach each other as the pattern develops. If the convergence is barely visible, the pattern is probably a channel or a very early-stage wedge that needs more time to develop.
How this lesson connects to what comes next
Lesson 22 covers cup and handle patterns and several lesser-known formations that don't fit cleanly into the reversal-versus-continuation categories we've used so far. The cup and handle in particular is structurally interesting because it combines elements of a rounding pattern (the cup) with a small flag-like structure (the handle), making it a hybrid that requires reading both components.
After Lesson 22, the Western chart pattern vocabulary will be complete. Lesson 23 builds the chart pattern interpretation framework — the parallel to Lesson 12 for candles. Location, magnitude, volume confirmation, measured-move targets, failure modes, multi-timeframe context — all the dimensions that turn pattern recognition into trade decisions.
Lesson 24 is the synthesis lesson where candle and chart analysis come together formally. The integrated reading we've been building throughout the chart pattern section gets laid out as a complete methodology students can apply systematically to any chart they look at.
Combined chart: V-bottom into bull flag into rising wedge
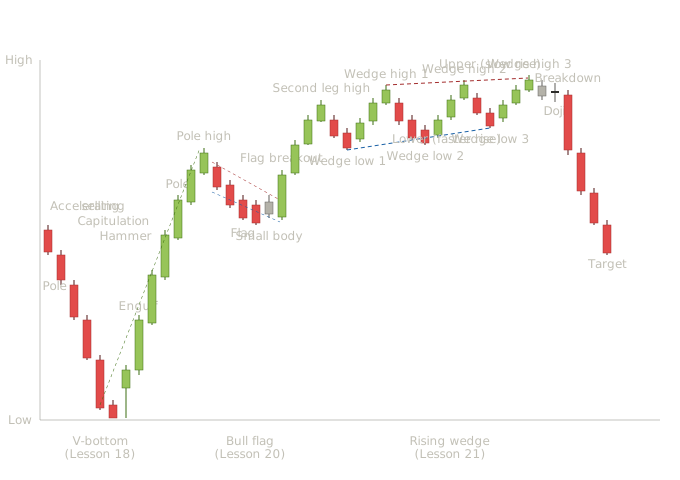
This chart traces a complete trend lifecycle from birth to exhaustion. The first half is bullish and familiar — capitulation reversal launches a strong uptrend, brief flag pauses extend it. The second half is where the lesson lives — the rising wedge reveals exhaustion despite price continuing to make new highs, and the breakdown signals the trend's actual end. Students need to internalize this sequence because real trends rarely die from a single dramatic event; they more often die through the gradual exhaustion that wedges expose. The accelerating decline (candles 1-5). Five bearish candles drive price lower with expanding bodies. From Lesson 18, this is the canonical capitulation buildup — bodies getting larger rather than smaller signals building panic rather than fading momentum. The fifth candle is the climactic session: long bearish near-marubozu pushing price to the chart's low with minimal lower shadow. The capitulation completion (candle 6). A small bearish candle that exhausts the selling — the move has reached the point where sellers have no more inventory and price stalls just above the climactic low. Hammer at the V-low (candle 7). Small bullish body near the top of an extended lower shadow. The four-dimension framework from Lesson 11 reads ideal: location at capitulation low, magnitude with the long lower shadow, immediate context with the accelerating bearish candles. From Lesson 18, this is the V-reversal turning point. Bullish engulfing confirmation (candle 8). A long bullish candle opens below the hammer's close and engulfs its body completely. Two reversal signals stacked back-to-back at the climax low — the highest-quality V-bottom configuration. The pole formation (candles 9-12). Four long bullish candles drive price up at a steep angle. Each candle is a near-marubozu with minimal upper shadow and close near the high. This is what a strong pole looks like, with conviction candle after conviction candle. The flag consolidation (candles 13-17). Five candles produce a small downward-sloping channel. The candle character is clearly different from the pole — smaller bodies, mixed colors, less directional conviction. This shift confirms the flag is a healthy pause rather than the start of a reversal. The small body in the middle of the flag (candle 17) shows the equilibrium that often precedes flag breakouts. After several sessions of mild bearish drift, a tiny-bodied session signals neither side is making progress. The flag breakout (candle 18). A long bullish near-marubozu breaks above the flag's upper trendline. Body dramatically larger than the flag's compressed candles, close well above the breakout level. Decisive resumption signal. The second leg up (candles 19-21). Three more bullish candles drive price to the chart's high. The second leg's character resembles the pole's character — long bullish bodies, minimal upper shadows. The trend is in full continuation mode at this point. The wedge begins forming (candles 22-23). Two small bearish candles pull price down moderately. The decline is contained — small bodies, not aggressive — which establishes the wedge's first lower trendline anchor at a level above the prior pole-to-flag low. Already this pullback shows different character from the flag's pullback: shallower, more hesitant. Wedge low 1 (candle 23). Price reaches the first lower trendline anchor. At this point we don't yet have a wedge — just a small pullback. Rally to wedge high 1 (candles 24-26). Three bullish candles drive price to a new high above the prior peak. Notice the body sizes carefully: these bullish bodies are smaller than the second leg's bullish bodies. Bullish conviction is starting to fade even though the highs continue rising — exactly the candle-character warning that distinguishes a healthy continuation from an exhausting one. Wedge low 2 (candles 27-29). Three small bearish candles drive price down to a level only slightly above wedge low 1. The lower trendline is rising, but it's rising steeply — the pullbacks are getting shallower fast. This is the structural detail students need to internalize: when each pullback bottoms only slightly higher than the previous one, while each rally tops higher more gradually, the lower trendline is rising faster than the upper trendline. The wedge is forming. Rally to wedge high 2 (candles 30-32). Three more bullish candles drive price to another marginal new high. Body sizes are smaller again — the candle character is now noticeably less convicted than during the pole, the flag breakout, or even wedge high 1. Each successive rally produces less buying force. Wedge low 3 (candles 33-34). Two small bearish candles drive price down to a level barely above wedge low 2. The lower trendline continues rising rapidly. The compression is accelerating toward the apex. Rally to wedge high 3 (candles 35-37). Three more bullish candles produce one final marginal new high. The bodies are smaller still — these are short-bodied sessions that barely register as conviction at all. From the candle-body trajectory reading habit, this is fading buying pressure made visible session by session. The small body and doji at the apex (candles 38-39). As the wedge nears its apex, indecision candles appear. The small-bodied candle followed by a doji — both with shadows extending in both directions — signal that the compression has reached the point where neither side can sustain even modest progress. The progressive shrinking of bodies across the entire wedge has reached its terminus. This is the critical moment for the wedge reading. Students who only watched the price chart see "price keeps making new highs, trend looks fine." Students who read the candle bodies across the formation see "each rally is weaker than the last, the bodies are shrinking, the apex is approaching." The two views diverge dramatically at this point. The candle-body view is the correct one. The breakdown candle (candle 40). A long bearish near-marubozu breaks decisively below the lower trendline. The body is large relative to the wedge's compressed candles — the contrast itself signals the resolution's significance. Price has gone from making marginal new highs to dropping sharply against the wedge's upward slope in a single session. This is the counter-slope resolution that defines rising wedge behavior. The pattern broke not because something dramatic happened externally but because the structural compression made the breakdown inevitable. Buyers couldn't maintain even minimal follow-through, and the structure failed in the only direction it could go. The decline toward target (candles 41-43). Three more bearish candles drive price toward the measured-move target — the height of the wedge at its widest point projected downward from the breakdown point.
The three-pattern sequence teaches something more advanced than any single pattern can teach alone: how to read trend health through pattern character. Reversal pattern (V-bottom) signals trend birth. The capitulation candle followed by hammer and bullish engulfing tells you the prior trend has ended and a new one is beginning. The strong pole that immediately follows confirms real conviction in the reversal. Healthy continuation pattern (bull flag) signals trend strength. The clean pole, the tight flag with proper counter-trend slope, the decisive breakout candle — all confirm the trend is in robust health. The flag's quick resolution (5 sessions) and the second leg's pole-like character signal buyers still have meaningful capacity to drive price. Exhausting continuation pattern (rising wedge) signals trend ending. The bodies shrinking session by session, the rallies producing only marginal new highs while pullbacks barely retreat, the indecision candles at the apex — all signal that the buying pressure that drove the earlier phases has dissipated. The trend is making cosmetic new highs while losing structural support.
This chart specifically rewards the candle-body trajectory reading that students have been building since Lesson 18. The trend's health is encoded in the bodies, not in the price levels: During the pole, bodies are long. Conviction is high. During the flag, bodies are short but in healthy mixed character. Consolidation pause. During the second leg, bodies return to long. Conviction has resumed. During the wedge, bodies progressively shrink across each successive rally. Conviction is fading even as price makes new highs. A trader watching only price would buy into the rising wedge expecting trend continuation and get caught in the breakdown. A trader watching candle bodies would see the fading conviction and either take profits, stop adding to positions, or even begin positioning short before the breakdown. This body-reading habit is one of the most valuable analytical tools in the entire curriculum because it transfers to every chart and every pattern. Trends die through fading conviction. Fading conviction is visible in candle bodies. Students who watch bodies see exhaustion before price confirms it; students who only watch price discover the exhaustion in retrospect after they've been on the wrong side of the breakdown.
This chart provides clear examples of how multiple patterns coordinate around a single trending move: Long entry opportunities: The bullish engulfing at the V-bottom — earliest entry, requires confidence in the capitulation. The flag breakout — clearer structural setup with tight stop placement just below the flag's lower trendline. Adding through the flag breakout for traders already long from the V-bottom — extending positions during confirmed continuation. Profit-taking and short entry opportunities: Early profit-taking as the rising wedge's body shrinkage becomes evident — sophisticated read that doesn't require waiting for structural breakdown. Full profit-taking at the doji apex of the wedge — clear signal that the structure is exhausted. Short entry on the breakdown candle — confirmed structural failure with the broken trendline as overhead resistance. The lesson for students isn't that they need to capture every entry and exit. It's that established trends provide multiple participation points throughout their lifecycle, and the patterns at different stages provide different kinds of signals. Recognizing which pattern you're looking at tells you which kind of decision you should be making.
This exact sequence — V-bottom into bull flag into rising wedge ending in breakdown — appears on every timeframe. Day traders on one-minute charts see it multiple times per week. Swing traders on daily charts see it several times per year per active instrument. Position traders on weekly charts see it across multi-year cycles. The reading habits transfer identically across all timeframes; only the clock changes.
The valuable exercise after working through this chart is to find rising wedges at the tops of completed uptrends on real charts. Have students pull up daily charts of stocks that had major rallies followed by meaningful declines, and look for the pattern in the transition zone. Real examples won't be as clean as this illustration — there will be more noise, occasional false signals during the wedge formation, sometimes irregular candle behavior at the breakdown — but the underlying structure recurs. Students who can identify three real-world examples of rising wedges at trend tops on charts they pull up themselves have developed an important warning system for their own trading. They'll recognize the pattern of fading conviction in their own positions and be prepared to act on it before the breakdown confirms what they should have already suspected.
Quiz — 3 Questions
Answer one at a timeA stock has been advancing in a pattern bounded by two converging ascending trendlines: the upper line connects rising highs and the lower line connects rising lows. A student sees the upward slope and holds long because 'price keeps making new highs.' What does the lesson say this pattern is and what resolution should the student actually expect?
In this lesson
300 — Western Chart Patterns — Structure, Candle Integration, Statistics