Double Tops and Double Bottoms
The double top and double bottom are simpler structural cousins of the head and shoulders.
Double Tops and Double Bottoms
The double top and double bottom are simpler structural cousins of the head and shoulders. Two peaks at roughly the same level, separated by an intervening pullback, mark a double top. Two troughs at roughly the same level, separated by an intervening rally, mark a double bottom. The neckline-and-measured-move framework students learned in Lesson 16 transfers directly. What changes is the peak count and what that simpler structure tells you about the underlying market dynamic.
Vocabulary
| Term | Definition |
|---|---|
| Double top | A bearish reversal pattern at the end of an uptrend, consisting of two peaks at approximately the same price level separated by a moderate pullback. The pullback's low defines the neckline. When price breaks below this neckline after the second peak, the pattern completes. |
| Double bottom | The bullish mirror. Two troughs at approximately the same price level separated by an intervening rally. The rally's high defines the neckline. When price breaks above the neckline after the second trough, the pattern completes. |
| First peak / first trough | The initial high or low in the pattern. As with the left shoulder in head and shoulders, the first peak is invisible as part of a larger pattern at the time it forms; it just looks like a normal pullback within the prevailing trend. |
| Second peak / second trough | The structural shift. Price rallies (or declines) again and reaches approximately the same level as the first peak (or trough) before reversing. The failure to make a new high (or new low) is the first concrete evidence that the trend may be ending. |
| Equal highs / equal lows | The defining feature. The two peaks (or troughs) should occur at approximately the same price. Perfect equality isn't required, but the peaks should be close enough that the level reads as a single resistance (or support) zone rather than two distinct events. |
| Valley / peak between | The pullback (in a double top) or rally (in a double bottom) that separates the two extremes. The depth of this intervening move matters: a shallow pullback isn't enough to qualify, while an extremely deep one starts to look like two separate trends rather than one pattern. Most practitioners look for a 10-20% pullback in the intervening move on daily charts, though this varies by timeframe and instrument. |
| Triple top / triple bottom | A close relative where the same level is tested three times instead of two. Generally regarded as a stronger pattern than the double variant because the level has been defended through an additional test, but rarer. |
Anatomy of a Double Top with Candle Pattern Integration
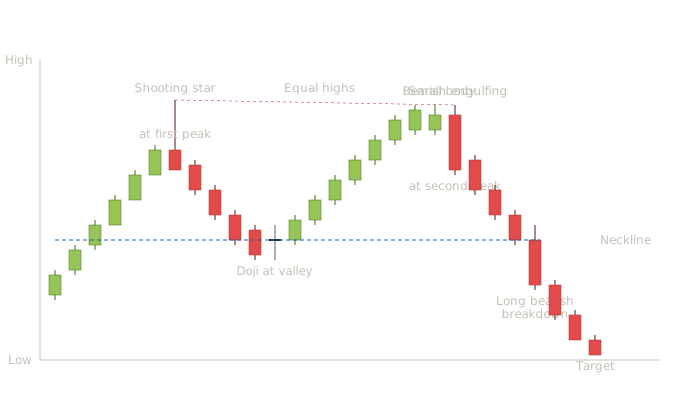
Reading the chart through both layers This is where the curriculum integrates. Students who learned candle patterns in lessons 1–13 and chart patterns in this section now see how the two work together within a single price sequence. The chart pattern tells the larger structural story; the candle patterns time the specific entries. The uptrend leading in (candles 1-6). Six consecutive bullish candles establish the prevailing uptrend. These are ordinary trend candles — not signals themselves, just the canvas on which the pattern will form. Each candle closes higher than the previous, with steady progress. This is exactly the trend context the double top will eventually reverse. First peak with a shooting star. At the first peak, notice the candle structure: a small bearish body sits near the bottom of an extended upper shadow. This is the shooting star pattern from Lesson 3 — buyers pushed price aggressively higher during the session and couldn't hold the gains. The shooting star alone doesn't tell us a double top is forming; we don't yet know there will be a second peak. But it does tell us this rally has hit resistance for at least one session, and the long upper shadow shows real selling pressure emerging at the high. A trader watching the candle-level view would see the shooting star as a single-candle reversal signal worth respecting — especially if it appeared after the extended six-candle rally. The combination of a strong uptrend plus an exhaustion candle at the peak is exactly the multi-dimension framing from Lesson 12: location is good (extended trend), magnitude is meaningful (long upper shadow), and confirmation arrives on the next session when price closes below the shooting star's body. The pullback to the neckline. Five bearish candles drive price down to the level that will become the neckline. None of these candles is a signal on its own — they're the structural decline that defines the pattern's intervening valley. Volume during this decline often reads as healthy distribution rather than panic selling, which is consistent with a topping pattern. Doji at the valley. When price reaches the neckline level, a doji forms. This is a textbook indecision candle from Lesson 2 — open and close at essentially the same price, with shadows showing the session tested both directions before resolving to neutral. Indecision at a support level often signals that the decline has paused. The doji isn't a complete reversal signal by itself, but combined with the subsequent bullish candles, it marks the bottom of the valley and the start of the rally back toward the prior peak. The rally to the second peak. Seven bullish candles drive price back up to retest the prior high. Notice how the candles get progressively smaller as the rally approaches the prior peak's level — this is one of the classic warning signs. Strong uptrends accelerate or maintain pace; rallies that lose momentum approaching a known resistance level often fail. By the time price reaches the prior peak, the candles are notably smaller than they were earlier in the rally. Bearish engulfing at the second peak. This is the critical moment. The session immediately before the second peak is a small-bodied bullish candle — the kind of pause we saw in Lesson 6's harami discussion. The next session opens above that small candle's close and then sells off dramatically, closing below its open and engulfing the prior body completely. This is the bullish engulfing pattern's mirror — a bearish engulfing from Lesson 5. The candle-level reader sees this as a reversal signal in its own right: long bearish body, complete engulfment of the prior candle, appearing at the top of a rally. The chart-level reader sees something more: this engulfing appears at exactly the prior peak's level, completing the double top's second peak with a powerful single-candle confirmation. The two analyses agree, and the agreement strengthens the signal substantially. A trader watching both layers had several possible entries here: a short on the bearish engulfing close, a tighter short on the confirmation candle the next session, or a more conservative short on the eventual neckline break. Each has different risk-reward characteristics, but all are valid because the multi-layer signal supports them. The decline to the neckline. Four bearish candles drive price back down toward the neckline. The candles are progressively larger as the decline gains momentum, which is the opposite of what we saw on the rally — accelerating bearish pressure rather than fading bullish pressure. This momentum shift is itself a structural signal. Long bearish breakdown candle. The neckline break occurs on a long bearish candle that closes well below the neckline level. This is essentially a bearish marubozu — minimal lower shadow, body spanning a large range. From Lesson 2's vocabulary, students recognize this as one-sided seller control during the breakdown session. The candle confirms the pattern decisively rather than tentatively. The measured-move target. The vertical distance from the peaks down to the neckline is projected downward from the breakdown point. The four bearish candles after the breakdown drive price toward this target, with declining magnitude as price approaches — the natural exhaustion of the directional move.
The double top isn't just two peaks at the same level. It's a sequence of structural events, each with its own candle-level signature that students can read in real time: The first peak is marked by an exhaustion candle (shooting star). The valley low is marked by an indecision candle (doji). The second peak is marked by a reversal candle (bearish engulfing) at the prior peak's level. The breakdown is marked by a decisive directional candle (long bearish near-marubozu). A student who only reads chart patterns sees this as "double top with neckline break and measured move." A student who only reads candle patterns sees a series of individual signals without realizing they connect into a larger structure. A student who reads both sees the complete picture: structural reversal pattern timed by specific candle signals at each critical moment. This is the integration we've been building toward. The two analysis systems aren't competing methodologies — they're two views of the same price action at different levels of zoom. Skilled traders use both simultaneously because they answer different questions. Chart patterns answer "what is the larger market doing?" Candle patterns answer "when specifically should I act?"
Double Bottom — the Bullish Mirror
The inverse pattern works identically in mirror, with candle pattern integration following the same logic at each critical point.
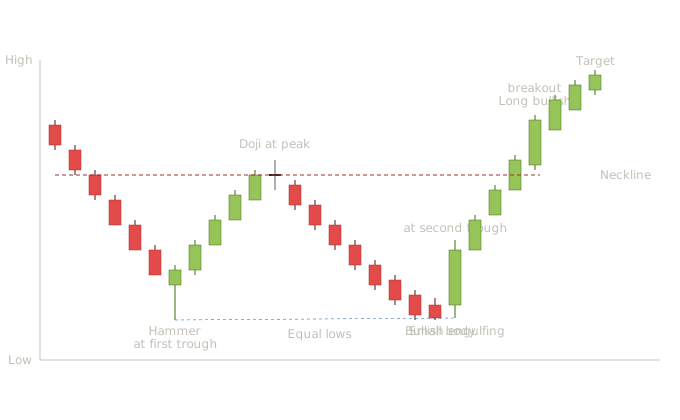
Reading the double bottom through both layers The double bottom mirrors the double top structurally and the candle integration follows the same logic at each critical moment: The downtrend leading in. Six bearish candles establish the prevailing downtrend — the context the pattern will reverse. Each session closes lower than the previous with steady selling pressure. No signals here, just the canvas. Hammer at the first trough. At the first low, a hammer forms — small bullish body near the top of the range with a long lower shadow. From Lesson 3, students recognize this as a classical bullish reversal candle at the bottom of a downtrend. Sellers pushed price down hard during the session, but buyers absorbed the selling and pushed the close back up. The hammer alone doesn't tell us a double bottom is forming; at this point we don't know there will be a second trough. But it tells us a level of buying interest has emerged at this price. A trader watching only candle patterns would treat this as a potentially tradeable signal in its own right, especially with the strong prior downtrend providing location quality. The chart pattern view doesn't yet exist — the pattern needs the second trough to come into being. The rally to the neckline. Five bullish candles drive price up to what will become the neckline level. Healthy buying, steady progress. The intervening rally that separates the two troughs. Doji at the peak. Indecision at the rally's high signals the bounce has paused. The doji from Lesson 2 — open and close at essentially the same price, both sides fought to a draw during the session. This often marks the end of the rally and the start of the second decline. The decline to the second trough. Seven bearish candles drive price back down toward the prior low. As with the double top's mirror, notice the candles get progressively smaller as the decline approaches the prior trough's level. The selling pressure is fading as price approaches a known support area — exactly the kind of momentum loss that often precedes a reversal. Bullish engulfing at the second trough. The small bearish candle just before the engulfing is the pause that precedes the reversal. Then a long bullish candle opens below the small candle's close and rallies powerfully to close above its open, engulfing the prior body completely. From Lesson 5, this is the bullish engulfing pattern — one of the more reliable two-candle reversal signals when location and magnitude are strong. Both location and magnitude are strong here. Location: at the prior trough's level, which is a known support area defended by buyers once before. Magnitude: the engulfing candle is dramatically larger than the candle it engulfs, showing decisive shift in control. The candle-level reader sees a bullish engulfing reversal signal. The chart-level reader sees the second trough of the double bottom completing with structural confirmation. Both views agree, and the agreement strengthens the signal. The rally to the neckline. Three bullish candles drive price up toward the neckline. The candles grow progressively larger — accelerating bullish pressure rather than fading bearish pressure, which is the mirror of what we saw on the second decline. Long bullish breakout candle. Price breaks above the neckline on a long bullish candle that closes well above the resistance level. Essentially a bullish marubozu — minimal upper shadow, body spanning a large range. One-sided buyer control during the breakout session. The candle confirms the pattern decisively. The measured-move target. The vertical distance from the troughs up to the neckline is projected upward from the breakout point. Three additional bullish candles drive price toward the target.
This integration shows your students something specific they couldn't see before: the chart pattern and the candle patterns aren't separate analyses — they're correlated views of the same underlying market behavior at different time scales. The candle signals appear exactly where the chart pattern structure predicts they should, because the same buyer-seller dynamics that create the small-scale candle patterns also create the larger-scale chart structures. A hammer at the first trough is what a "first trough" looks like at the candle level. A bullish engulfing at the second trough is what "second trough completion" looks like at the candle level. The breakout candle is what "neckline break" looks like at the candle level. The chart pattern is the geometry; the candle patterns are the textures within it. For students, this means the two skill sets reinforce each other rather than competing for cognitive space. A student who has learned both can use either view as a check on the other: "I see a possible double bottom forming, but is there a reversal candle at the second trough? If not, I should be cautious." Or: "I see a bullish engulfing at what looks like support. Is there a larger structural reason this level matters? Is this the second trough of a possible double bottom?" The synthesis at Lesson 24 will formalize this approach, but it starts here. Every chart pattern lesson from now on will include candle pattern integration at the critical structural moments, because that's how skilled traders actually read price action.
Pattern Statistics and Sources
Double top
| Attribute | Notes |
|---|---|
| Confirmation rule | Daily close below the neckline. A retest of the broken neckline that fails to recapture it provides additional confirmation. |
| Volume signature | Higher volume on the first peak, lower volume on the second peak, expanding volume on the neckline break. Declining volume across the two peaks is one of the classical warning signs that the second rally is unsustainable. |
| Reliability | Generally regarded as a respected reversal pattern, with reliability dependent on methodology and pattern strictness. |
| Common failure mode | Second peak exceeds the first peak's level, invalidating the pattern. Neckline break recovers within a few sessions. |
Cited statistics:
Bulkowski's updated thepatternsite.com data (1,114 Adam & Adam variant trades) reports a 25% break-even failure rate for the confirmed double top — meaning 75% of patterns that close below the neckline move at least 5% lower. The Eve & Eve variant performs slightly better at 80%. Without neckline confirmation, twin-peak formations fail 65% of the time as price continues rising, making the confirmed close the single most important factor.
Volity's review cites Bulkowski's research showing double tops succeed around 65% of the time, with reliability improving when the breakout happens with strong volume. They note double tops can be more prone to false signals than double bottoms, especially in volatile markets.
Volity's broader review of the literature places double top and double bottom success rates in the 60% to 70% range depending on market conditions and confirming factors like volume.
Double bottom
| Attribute | Notes |
|---|---|
| Confirmation rule | Daily close above the neckline. |
| Volume signature | Heavier volume on the first trough often shows real seller pressure; lighter volume on the second trough shows fading conviction; expanding volume on the breakout confirms buyer participation. |
| Reliability | Generally regarded as among the more reliable reversal patterns, particularly when forming after sustained downtrends. |
| Common failure mode | Second trough breaks below the first trough's low, invalidating the pattern. Breakout fails to follow through and price returns below the neckline. |
Cited statistics — note the wide spread:
Liberated Stock Trader's testing reports an 88% success rate for double bottoms in bull markets with average profit potential of +50%. They describe it as one of the most reliable and accurate chart indicators in technical analysis, and note a reliable double bottom usually takes two to three months to form on a daily chart.
Liberated Stock Trader's broader chart pattern research ranks the double bottom among the most reliable patterns at 88% success rate, alongside the head and shoulders at 89% and the triple bottom and descending triangle at 87%.
Volity cites Bulkowski's chart pattern research showing double bottoms work about 78% of the time, slightly higher than double tops at 65%. They note that reliability improves when the breakout happens with strong volume.
FasterCapital's example backtest of the double bottom pattern over a one-year period found about 75% success rate in predicting bullish reversals.
An independent backtest using algorithmic shape recognition on ProRealTime generated a 47% success rate from 159 entries. The author specifically notes that despite claims of 80%+ success rates for double bottoms in many sources, their algorithmic backtest produced substantially lower reliability — emphasizing the importance of neckline management and confirmation rules.
QuantifiedStrategies notes a methodological caution: Bulkowski's high reliability figures come from manual pattern detection, where human judgment can subtly favor patterns that "look right" before testing. They argue that fully quantified backtest rules without human interpretation tend to produce lower reliability figures, and recommend students be cautious about over-relying on manually-derived statistics.
Double bottom reliability ranges from 47% (algorithmic detection, strict rules) to 88% (manual detection, looser interpretation) across credible sources. That's a 41-percentage-point spread for the same named pattern. The teaching point isn't that one source is right and others are wrong — it's that methodology drives outcomes for chart pattern statistics. The methodological choices that drive the spread are the same ones we covered in Lesson 16: **How is pattern formation defined?** Strict definitions (exact equal lows, specific volume signatures, specific time windows between troughs) produce fewer patterns but higher reliability. Loose definitions (any two roughly-similar lows) produce more patterns but lower reliability. **How is success defined?** A break-even-plus-5% move counts as success in Bulkowski's framework. Reaching the full measured-move target counts in some others. Any directional movement counts in still others. **Manual versus algorithmic detection?** Manual detection allows human judgment to identify "clean" patterns, which tends to inflate reliability figures. Algorithmic detection applies consistent rules to every candidate, which tends to deflate them. The gap between the two is one of the largest sources of disagreement across sources. **Market and timeframe?** Bull-market figures often look better than bear-market figures for bullish patterns. Daily-chart figures often look better than 5-minute-chart figures. For your students, the practical takeaway: double bottoms and double tops are real patterns with real edges, but the exact reliability you can expect depends heavily on how strictly you're willing to define what counts as the pattern, what counts as success, and what market and timeframe you're trading. A student who internalizes this framing is better prepared than one who memorizes a single number.
Multi-source pool
For students who want to dig deeper into double top and double bottom statistics:
- thepatternsite.com (Bulkowski) — most extensive single source with Adam & Adam, Adam & Eve, Eve & Adam, Eve & Eve variants tested separately.
- liberatedstocktrader.com — backtests with explicit success-rate figures and average profit potential.
- quantifiedstrategies.com — methodological commentary alongside backtest figures, often more skeptical than other sources.
- chartscout.io — recent backtest aggregation including crypto-specific data.
- volity.io — review-style summaries that aggregate across multiple sources.
- artificall.com — algorithmic backtest with ProRealTime methodology, useful as a counterweight to manually-derived figures.
- Academic literature via Google Scholar — search "double top double bottom technical analysis" or "twin peak pattern profitability."
Common Student Mistakes with Double Tops and Bottoms
The pattern requires a prior uptrend leading in. Two peaks at the same level in choppy sideways action aren't a double top — they're just a horizontal resistance level being tested. Students need to confirm the prior trend before labeling the formation.
The most common and expensive mistake. A double top forming is not a double top complete. Until price breaks below the neckline, the second peak could rally above the first peak's level and invalidate everything. Bulkowski's research explicitly notes that without neckline confirmation, twin-peak formations fail 65% of the time as price continues rising. Students who short on the second peak rather than waiting for the neckline break are trading against the majority outcome.
The two peaks should be at approximately the same level, not exactly the same level. A 1-3% difference between peaks is usually fine; a 10% difference probably means you're looking at two separate trends rather than one pattern.
A double top with a tiny pullback between the peaks isn't really a double top — it's two close peaks. The intervening valley needs to be substantial enough that the second rally is genuinely retesting the prior resistance after a meaningful retreat. Most practitioners look for a 10-20% pullback on daily charts as the minimum.
This is the new mistake that integration teaches us to avoid. A double top without a reversal candle at the second peak is structurally a double top but lacks the candle-level signal that strengthens it. Students should specifically look for shooting stars, gravestone dojis, bearish engulfing patterns, or evening stars at the second peak to confirm what the chart pattern is suggesting. A double top with a strong reversal candle at the second peak is materially stronger than one without.
How This Lesson Connects to What Comes Next
Lesson 18 covers rounding tops and bottoms, V-shaped reversals, and saucer patterns — reversal patterns that lack the sharp peak-and-trough structure of head and shoulders or double tops. These patterns reverse through gentler curves or violent spikes rather than through clear structural levels. Once we complete Lesson 18, the reversal pattern family is complete, and we move into continuation patterns starting in Lesson 19 with triangles.
The candle integration approach continues throughout. Rounding patterns have characteristic candle signatures at their inflection points; V-reversals have specific candle structures that distinguish them from random spikes; triangles have characteristic candles at their breakouts. Each lesson builds on the integration habit we established here.
Quiz — 3 Questions
Answer one at a timeBulkowski's research states that without neckline confirmation, twin-peak formations fail 65% of the time as price continues rising. A student has identified two peaks at the same level with an intervening valley but price hasn't yet closed below the neckline. What does the 65% figure mean for this student's decision?
In this lesson
300 — Western Chart Patterns — Structure, Candle Integration, Statistics