Head and Shoulders and Inverse Head and Shoulders
The head and shoulders is the most iconic chart pattern in technical analysis. Students who learn nothing else about Western pattern analysis will still recognize this one.
Head and Shoulders and Inverse Head and Shoulders
The head and shoulders is the most iconic chart pattern in technical analysis. Students who learn nothing else about Western pattern analysis will still recognize this one. It marks the transition from an uptrend to a downtrend through three distinct peaks, and its inverse form marks the transition from a downtrend to an uptrend through three distinct troughs. The pattern's reputation comes from both its visibility (it's hard to miss when it forms) and its consequences (when it works, the reversal is often substantial).
Vocabulary
| Term | Definition |
|---|---|
| Head and shoulders top | A bearish reversal pattern appearing at the end of an uptrend. Three peaks form in sequence: a left shoulder (a high), a head (a higher high), and a right shoulder (a high that fails to reach the head's level). The lows between the peaks define a neckline, which acts as support during the formation and becomes the breakdown trigger when the pattern completes. |
| Left shoulder | The first peak in the pattern. Formed when an existing uptrend produces a rally and pullback. At the time the left shoulder forms, it looks like a normal pullback within an ongoing uptrend — there's no way to know yet that this is the start of a reversal pattern. |
| Head | The second peak, higher than the left shoulder. This represents the trend's final push to a new high before exhaustion sets in. The head is often where the strongest buying enthusiasm reaches its climax, with the highest sentiment readings, the most retail participation, and the broadest media coverage of the underlying asset. |
| Right shoulder | The third peak, which fails to reach the height of the head. The failure to make a new high is the structural shift — buyers tried, but couldn't push price past the prior peak. This failure to confirm the uptrend is the first concrete evidence that the trend may be reversing. |
| Neckline | A line connecting the lows that formed between the peaks. The neckline can be horizontal or sloping, and it acts as the support that the pattern is testing. When price closes decisively below the neckline, the pattern completes and the reversal is confirmed. |
| Neckline break | The breakdown event that confirms the pattern. Most practitioners require a daily close below the neckline (not just an intraday wick through it) to count the break as valid. |
| Neckline retest | After the breakdown, price often rallies back to the broken neckline before continuing lower. This retest is the role-reversal principle in action — the neckline that was support is now resistance. The retest is one of the best entry opportunities for traders who missed the initial breakdown. |
| Measured move | The price target projected from the pattern's dimensions. For a head and shoulders top, the measured move equals the vertical distance from the head's peak to the neckline, projected downward from the neckline breakdown point. If the head is $100 and the neckline is $90, the measured-move target is $80 (the $10 distance subtracted from the $90 breakdown level). |
| Inverse head and shoulders | The bullish mirror pattern, appearing at the end of a downtrend. Three troughs form: a left shoulder (a low), a head (a lower low), and a right shoulder (a low that fails to reach the head's depth). The pattern completes when price closes decisively above the neckline. |
| Volume signature | A characteristic volume profile that strengthens the pattern when present. The classical pattern shows declining volume across the three peaks (heaviest on the left shoulder, lighter on the head, lightest on the right shoulder), then expanding volume on the neckline break. Volume signatures aren't required for the pattern to be valid but they significantly affect reliability. |
| Symmetry | The relative similarity between the left shoulder and right shoulder in height, width, and duration. Symmetric patterns are generally regarded as more reliable than asymmetric ones, though perfect symmetry isn't required. |
Anatomy of a Head and Shoulders Top
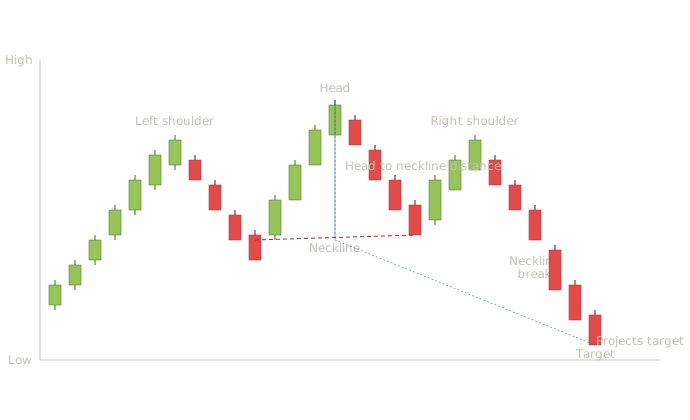
The chart walks through a complete head and shoulders top in candlestick form. Each phase tells a different part of the story: The uptrend leading in. The first seven candles form a clean uptrend — each session pushing higher with strong bullish bodies. This is the existing trend the pattern will eventually reverse. Without this prior uptrend, the formation that follows wouldn't be a head and shoulders top; it would just be three peaks in random price action. The left shoulder. Price reaches a peak, then pulls back. At the time this peak forms, there's nothing distinctive about it — it looks like a normal high within an uptrend. The pullback after it looks like a normal pullback. Students should internalize this: the left shoulder is invisible as such until the rest of the pattern develops. You can't trade a left shoulder; you can only recognize it in retrospect. The head. Price rallies again, this time exceeding the left shoulder's high. The new high is what students would expect from a continuing uptrend — higher highs and higher lows is exactly what an uptrend looks like. The head is the final triumphant push of the uptrend, and again, at the time it forms, it doesn't look like the start of a reversal. The right shoulder. This is the structural shift. Price rallies a third time, but fails to reach the head's level. The failure to make a new high is the first concrete evidence that buyers have lost the ability to push price higher. The rally tops out approximately at the left shoulder's level, creating the rough symmetry that gives the pattern its name. The neckline break. Price falls from the right shoulder back to the neckline — the line connecting the two intervening lows — and then breaks decisively below it. This is the moment the pattern completes. The breakdown is typically accompanied by a long bearish candle and ideally by expanding volume. The measured-move target. The vertical distance from the head to the neckline is measured, then projected downward from the neckline break point. The target shown on the chart represents this projection. Statistically, measured moves are reached more often than not but not always — they're targets, not guarantees. Reading the chart with candle-pattern integration Notice how candle patterns from earlier lessons appear within this chart pattern. Near the head's peak, you can see what looks like a small bearish reversal candle that warned of the coming pullback. At the right shoulder's peak, another similar warning. At the neckline break, a long bearish marubozu-like candle that confirms the breakdown decisively. This is the multi-timeframe synthesis Lesson 24 will formalize. The chart pattern provides the structure — telling you a reversal is forming and where to expect it to complete. The individual candle patterns within the structure provide the timing — telling you when specific entries are warranted. A trader watching this chart had several entry opportunities: a small short at the right shoulder peak after a bearish candle signal, a short on the neckline break itself, and a short on the subsequent retest of the broken neckline from below.
Inverse Head and Shoulders — The Bullish Mirror
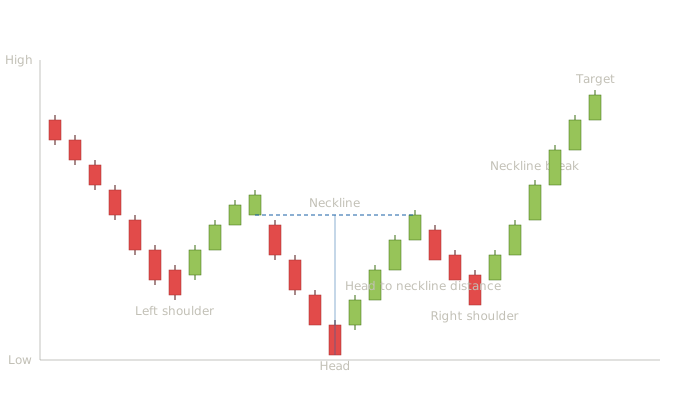
The inverse head and shoulders is the bullish mirror. Three troughs form instead of three peaks: the left shoulder is a low, the head is a deeper low, the right shoulder is a low that fails to reach the head's depth. The neckline connects the two highs between the troughs. The pattern completes when price closes decisively above the neckline. The chart walks through the same structural narrative as the head and shoulders top, just inverted. Sellers drive price down through the left shoulder, push it deeper to the head, then try once more for a new low and fail — the right shoulder forms higher than the head. Buyers regain control, push price up to the neckline, and break through. The measured-move target is the head-to-neckline distance projected upward from the breakout point. The psychology is the mirror image too. Sellers were in control on the way down, made their final triumphant push at the head, and then ran out of capacity. The right shoulder is the structural shift — sellers tried for a new low and couldn't make it. Buyers, sensing weakening downside pressure, stepped in and eventually overwhelmed the remaining sellers at the neckline.
Pattern Statistics and Sources
The head and shoulders pattern has been tested extensively across multiple methodologies. The reliability figures cluster widely, and that wide cluster is itself an important teaching point.
Head and shoulders top
| Attribute | Detail |
|---|---|
| Confirmation rule | Daily close below the neckline. A retest of the broken neckline that fails to recapture it provides additional confirmation. |
| Volume signature | Classical pattern shows declining volume across left shoulder, head, and right shoulder, with expanding volume on the neckline break. |
| Reliability | Generally regarded as among the most respected reversal patterns in technical analysis, though reported statistics vary widely across sources. |
| Common failure mode | Right shoulder rallies above the head, invalidating the pattern. Neckline break recovers within a few sessions and price returns above the neckline. |
Cited statistics — note the wide spread:
Liberated Stock Trader's testing reports the head and shoulders top pattern as having an 81% success rate with an average price move of -16% during bull market conditions.
Bulkowski's updated 2020 research (based on 2,800+ trades) found a break-even failure rate of 19%, meaning 81% of patterns that break the neckline drop more than 5% and continue in the expected direction.
Bapital's backtesting data of 4,034 head and shoulders patterns on daily price charts across multiple financial markets found a 52% win rate — substantially lower than the 80%+ rates claimed by other sources. They note that the higher-timeframe patterns (daily, weekly, monthly) are more reliable than shorter-timeframe ones.
QuantifiedStrategies references Bulkowski's earlier research showing a 93% success rate from a sample of 431 patterns where only 30 produced false signals. They note Bulkowski's finding that volume has no statistically significant impact on the formation's success in his testing — a counterintuitive result that contradicts the traditional emphasis on volume confirmation.
Tradervue's review of studies puts the range at 60% to 80% success rates for head and shoulders patterns.
A TradingView research post argues that actual success rate is probably closer to 60% than the 90%+ sometimes claimed, after accounting for failed patterns and methodology choices.
QuantifiedStrategies' aggregated research notes that false breakouts occur in about 20-30% of head and shoulders patterns, that approximately 70% of these patterns form in trending markets while 30% occur in ranging markets, and that volume-confirming patterns (declining on shoulders, increasing on breakout) have a 10-15% higher success rate than patterns without that volume signature.
Inverse head and shoulders
| Attribute | Detail |
|---|---|
| Confirmation rule | Daily close above the neckline. |
| Volume signature | Declining volume across the three troughs, expanding volume on the breakout. |
| Reliability | Generally regarded as comparable to the head and shoulders top in mirror. |
| Common failure mode | Right shoulder breaks below the head's low, invalidating the pattern. Breakout recovers within a few sessions and price returns below the neckline. |
Cited statistics:
VT Markets cites 2025 research showing inverse head and shoulders patterns on daily charts achieved success rates near 71%, with average holding periods of 3-7 weeks from initial breakout to reaching the profit target. Weekly chart patterns showed the highest reliability at 78% with average gains exceeding 18% from breakout to price objective.
The same source found that patterns breaking out on low volume have significantly lower success rates — approximately 54% versus 73% for volume-confirmed breakouts.
The TradingView research notes that some sources claim around 98% success rate for the inverse head and shoulders, but argues actual reliability is closer to 60-70% after accounting for methodology variations.
The reliability statistics for head and shoulders patterns range from 52% to 93% across credible sources. That spread is dramatic, and students should understand why before they internalize any single figure. The methodological choices that drive the spread: How is "success" defined? A 5% move beyond the neckline counts as success in some studies. The full measured-move target counts as success in others. Any directional movement at all counts in still others. The same pattern can be 93% reliable under one definition and 52% reliable under another. Which markets are tested? Patterns tend to perform differently across equity markets, futures, forex, and cryptocurrency. Aggregate statistics that combine markets can obscure performance differences that matter to traders working in a specific instrument. Which timeframes? Daily charts produce different reliability than 5-minute charts, as both VT Markets and Bapital's research confirms. Studies that don't specify timeframe are difficult to interpret. Were transaction costs included? A pattern with a positive raw edge may have a negative net edge after spreads, commissions, and slippage. What counted as a valid pattern? Some studies use loose pattern definitions (any three peaks with the middle highest counts). Others enforce strict symmetry, volume signatures, and trend context requirements. Strict definitions produce fewer patterns but higher reliability rates. The practical implication for your students: when they find a single reliability number quoted somewhere, that number is roughly meaningless without context. The right framing is "head and shoulders patterns produce favorable outcomes more often than chance, with reliability strongly dependent on methodology, market, timeframe, and pattern strictness." Students who internalize this framing become better consumers of trading research than students who memorize a single number.
Bulkowski's Encyclopedia of Chart Patterns and his pattern site (thepatternsite.com) — most extensive single source. Edwards and Magee's Technical Analysis of Stock Trends — the foundational text where head and shoulders patterns were codified for Western audiences. Academic literature via Google Scholar — search "head and shoulders technical analysis" or "chart pattern profitability." Key researchers include Lo, Mamaysky, and Wang (a notable 2000 paper testing chart patterns including head and shoulders), Osler, and Caginalp. Liberated Stock Trader, Bapital, QuantifiedStrategies, Tradervue, VT Markets — trading-focused sources with backtested figures. TradingView's community research posts — useful for cross-checking claims against independent analysis.
Common Student Mistakes with Head and Shoulders Patterns
The pattern requires an existing uptrend leading in. Three peaks in choppy sideways action aren't a head and shoulders top — they're just three peaks. Students need to confirm the prior trend before labeling the formation.
A head and shoulders forming is not a head and shoulders complete. Until price breaks below the neckline decisively, the pattern can still fail — the right shoulder could rally above the head, invalidating everything. Students who short on the right shoulder peak rather than waiting for the neckline break take on substantial risk that the pattern will simply resolve as a continuation of the uptrend.
A head and shoulders top after a 20% rally is a different pattern from a head and shoulders top after a 200% rally. The larger the prior trend, the larger the reversal that's possible. Students should match position sizing to the size of the trend being reversed, not to the size of the pattern itself.
Necklines are often slightly sloping rather than perfectly horizontal, and they're zones rather than razor-precise prices. A close 2-3 ticks below the neckline may not be a meaningful break; a close several percent below the neckline almost certainly is. Students need judgment about what counts as a "decisive" break, and most sources recommend either a meaningful percentage break or a confirming close one to two sessions after the initial break.
When the neckline breaks, price often retraces back to it before continuing lower. Many students who missed the initial break give up on the trade rather than waiting for the retest. The retest is often a better entry than the initial break because the risk-to-reward improves (stops can sit just above the neckline rather than further away) and the broken-support-now-resistance dynamic adds confirmation.
How This Lesson Connects to What Comes Next
Lesson 17 covers double tops and double bottoms — patterns with two peaks or two troughs rather than three. They share much of the same logic as head and shoulders (neckline confirmation, measured-move targets, role-reversal retests) but with simpler structure. Students who understand head and shoulders find double tops/bottoms straightforward because the conceptual framework transfers directly.
Lesson 18 covers rounding patterns and V-shaped reversals — patterns that lack the sharp peak-and-trough structure of head and shoulders and instead reverse through gentler curves or violent spikes. These complete the reversal pattern family before we move into continuation patterns starting in Lesson 19.
Quiz — 3 Questions
Answer one at a timeA head and shoulders top has fully formed with a clear neckline. Price is at the second shoulder's level but has not yet broken below the neckline. A student shorts here. What is the primary problem with this timing?
In this lesson
300 — Western Chart Patterns — Structure, Candle Integration, Statistics