Triple Tops and Triple Bottoms
The triple top and triple bottom are close structural relatives of the double tops and double bottoms covered in Lesson 17. Where doubles have two peaks or troughs at the same level, triples have three. The additional touch at the same level makes the structure significantly stronger — by the third test of resistance or support, the level has been defended through three separate attempts, and market participants worldwide are clearly watching it. When the level finally breaks, the breakdown or breakout often produces substantial follow-through because so many traders had positioned around the defended level. Triple patterns appear less frequently than double patterns for a structural reason worth understanding: most twin-peak setups resolve before the third touch can form. Either the second peak fails to reach the first peak's level (creating a head and shoulders structure if the third peak forms below both, or just a failed retest if no third peak develops), or the second peak exceeds the first peak's level (invalidating the double-top setup entirely). Only when the second peak reaches almost exactly the same level as the first, and a third rally then reaches the same level again, does a triple top form. The structural rarity is what gives triple patterns their reputation for reliability — markets that defend a level three times with such precision are typically committing serious participation to that level.
- Distinguish triple tops and bottoms from head and shoulders patterns using the approximately-equal-extremes rule
- Distinguish triple patterns from rectangles using the prior-trend requirement
- Read the candle character progression across three peaks (shooting star → gravestone doji → bearish engulfing) as escalating seller conviction
- Apply the measured-move calculation (pattern height projected from neckline break) for targets
- Interpret the wide reliability spread (41%–88% for triple tops, 74%–87% for triple bottoms) using the manual-versus-algorithmic detection distinction
- Identify the seven candle-level signals in the combined multi-pattern chart
Vocabulary
| Term | Definition |
|---|---|
| Triple top | A bearish reversal pattern at the end of an uptrend, consisting of three peaks at approximately the same price level, separated by two intervening pullbacks. The pullback lows define the neckline. When price breaks below this neckline after the third peak, the pattern completes. |
| Triple bottom | The bullish mirror. Three troughs at approximately the same price level, separated by two intervening rallies. The rally highs define the neckline. When price breaks above the neckline after the third trough, the pattern completes. |
| First peak / first trough | The initial high or low in the pattern. As with double patterns from Lesson 17, the first peak is invisible as part of a larger pattern at the time it forms. |
| Second peak / second trough | The structural confirmation that a level is being defended. When price rallies (or declines) again and reaches approximately the same level as the first peak (or trough) before reversing, the level becomes identifiable as resistance (or support) rather than coincidence. |
| Third peak / third trough | The structural shift that defines the triple pattern specifically. After the second peak, the market might have rallied above the prior peaks (continuing the uptrend) or formed a head and shoulders top (with the second peak being the head). The third peak reaching approximately the same level as the first two confirms the triple-top structure specifically. |
| Approximately equal extremes | The defining feature of triple patterns. All three peaks (or troughs) should occur at approximately the same price. Perfect equality isn't required — a 1-3% variation between extremes is generally acceptable on daily charts, with tighter tolerance giving cleaner pattern identification. |
| Intervening valleys / intervening peaks | The two pullbacks (in triple tops) or rallies (in triple bottoms) that separate the three extremes. The depth of these intervening moves matters: the valleys (or peaks) should be at approximately the same level as each other, creating a clear neckline that can be drawn through them. |
| Triple top neckline | The horizontal line drawn through the two intervening valleys in a triple top. The line acts as support during the pattern's formation and becomes the breakdown trigger when the pattern completes. Generally drawn through the higher of the two valley lows for a more conservative breakdown level. |
| Triple bottom neckline | The horizontal line drawn through the two intervening peaks in a triple bottom. Acts as resistance during formation, breakout trigger when pattern completes. Generally drawn through the lower of the two peak highs. |
| Measured move | Calculated by taking the height of the pattern (vertical distance from the three peaks to the neckline) and projecting that distance from the breakdown or breakout point in the resolution direction. Same calculation as double tops and bottoms. |
| Triple pattern versus head and shoulders | Critical distinction students need to learn. A triple top has three peaks at approximately the same level. A head and shoulders top has the middle peak higher than the two flanking peaks. The two patterns can look similar at first glance but have different structural rules and different implications. If the middle peak is meaningfully higher than the others, the pattern is a head and shoulders. If all three peaks are at approximately the same level, the pattern is a triple top. |
| Triple pattern versus rectangle | Another important distinction. A rectangle (Lesson 21) is a sideways consolidation bounded by horizontal lines, with price oscillating between them without strong directional bias. A triple top requires a prior uptrend leading in — the pattern is a reversal of that uptrend, not just sideways trading. Without the prior trend, three peaks at the same level are just resistance being tested, not a triple top. |
Anatomy of a triple top with candle integration
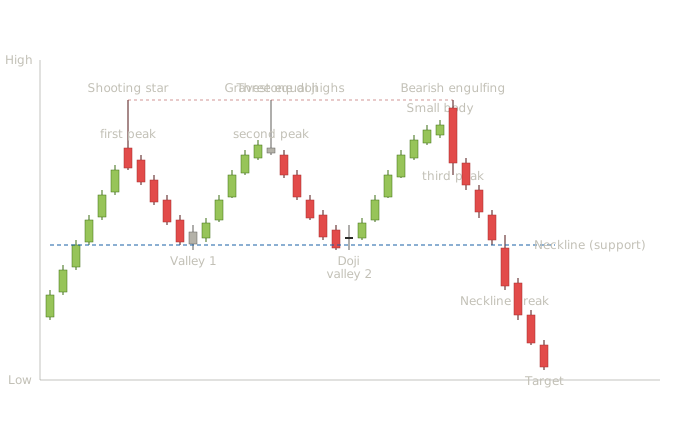
The triple top tells a story of three sequential failed attempts to push price higher, each marked by its own candle-level reversal signal. Students who learned double tops in Lesson 17 will recognize most of the structural elements; what's new is the additional peak and what the candle character of each peak tells us about the developing pattern.
Six bullish candles drive price up with consistent moderate bodies. Normal trend candles establishing the prior trend that the triple top will reverse. Without this prior uptrend, the formation that follows wouldn't be a reversal pattern — it would just be a horizontal resistance level being tested.
The candle at the first peak is a shooting star — small bearish body sitting near the bottom of an extended upper shadow. From Lesson 3, this is the canonical bearish reversal candle at the top of a rally: buyers pushed price aggressively higher during the session, but sellers absorbed the buying and pushed the close back down to near the open. The four-dimension framework from Lesson 11 reads well: extended prior rally provides good location, the long upper shadow provides meaningful magnitude, and the close near the open shows real selling pressure emerged at the high. A trader watching only candles would treat this as a single-candle reversal signal in its own right. The chart pattern view doesn't yet exist — at this point, we just have a peak that might be the start of something or might be a temporary stall.
Four bearish candles drive price down to what will become the neckline level. The decline is orderly with moderate bodies — buyers are taking profits, not panicking. This is what a healthy pullback within a developing topping pattern looks like.
A small candle marks the first valley low. The small body indicates the decline has paused — sellers have run out of pressure at this level. From Lesson 4, this is essentially a spinning top in the context of a pullback bottoming.
Five bullish candles drive price back up toward the prior peak's level. Notice the candle character is similar to the original uptrend — moderate bodies with steady progression. The market is making another sincere attempt to push higher.
This is the critical candle pedagogically. The second peak forms with a gravestone doji — open and close at essentially the same price near the session's low, with an extended upper shadow probing back to the same resistance level that rejected price at the first peak. From Lesson 2, this is maximum bearish indecision at resistance: buyers tried to push higher during the session but couldn't sustain the close at all. The gravestone doji at the second peak is particularly significant in a triple top context because it tells students immediately that the resistance level is being defended seriously. Where a more decisive reversal candle (engulfing or shooting star) suggests sellers actively overwhelming buyers, the doji suggests buyers can't even make progress — the resistance is so firm that the session ends back at the session low after probing it.
The double top pattern reading from Lesson 17 would now suggest waiting for the neckline break. But what happens next changes the interpretation.
Four bearish candles drive price back down toward the neckline. The decline is orderly with bodies similar to the first pullback. The market is testing the support level for a second time.
Indecision at the support level — the doji indicates the decline has paused at the same area that supported price during the first pullback. This second touch of the neckline confirms the support level is real, but it also sets up the structural opportunity for either resolution: the market could break down here (forming a double top) or rally for a third test of the resistance.
Six bullish candles drive price back up to test the prior resistance level a third time. Notice the candles get progressively smaller as the rally approaches the prior peaks — fading bullish conviction is one of the classic warning signs in topping pattern development. By the time price reaches the prior peak's level, the candle right before the third peak is notably small. This is where the triple top distinguishes itself from a head and shoulders pattern. In a head and shoulders top, the second peak (the head) would exceed the first peak's height. In a triple top, all three peaks reach approximately the same level. The market is testing the same resistance line three separate times.
The small body shows the equilibrium that often precedes the final reversal. After several sessions of fading bullish progress, this tiny-bodied session signals that the rally is exhausting itself approaching the prior resistance.
A long bearish candle opens above the small candle's close and rallies briefly to the prior resistance level, then sells off dramatically to close below the small candle's open, engulfing its body completely. From Lesson 5, this is the bearish engulfing pattern — and it appears exactly at the third peak's level, completing the triple top with structural and candle-level confirmation simultaneously. The candle-level reader sees the bearish engulfing at extended-rally location with strong magnitude as a powerful reversal signal in its own right. The chart-level reader sees the triple top's third peak completing with the most decisive candle pattern of the three peaks. Both views agree, and the agreement at the third peak specifically — versus the more subtle signals at the first two peaks — is what gives the triple top its reputation for follow-through. By the time the third peak forms with a decisive reversal candle, the market has been telling traders for weeks that this level matters.
Three bearish candles drive price toward the neckline level. The candles grow progressively larger — accelerating bearish pressure that confirms the topping pattern is real rather than another temporary pullback.
A long bearish candle breaks decisively below the neckline support. The body is large relative to recent candles, the close is well below the support level, the structure is near-marubozu with minimal lower shadow. From Lesson 2, this is the high-quality breakdown candle that confirms the triple top's resolution.
Three more bearish candles drive price toward the measured-move target — the height of the triple top (from peaks to neckline) projected downward from the breakdown point.
Each peak provides its own candle-level signal. A textbook triple top doesn't just produce one reversal candle at one peak — it produces three. The first peak's shooting star, the second peak's gravestone doji, and the third peak's bearish engulfing are each tradeable signals in their own right. A trader watching only chart patterns waits for the neckline break and may miss most of the move. A trader watching only candle patterns might trade each peak's reversal candle individually, getting whipsawed when the level holds and price rallies again. The integrated reader recognizes the developing pattern and can choose entries that suit their risk tolerance — aggressive at the first peak's reversal candle, moderate at the second peak's after the level has been confirmed once, or conservative at the third peak's or the neckline break. The candle character progression tells the story. Notice how the reversal candle at each successive peak became more decisive: shooting star at peak one (suggestive), gravestone doji at peak two (firmer, showing pure indecision at a now-confirmed level), and bearish engulfing at peak three (decisive seller dominance). This progression isn't required for a valid triple top, but it's common because each successive failure at the resistance brings more participants to the conclusion that the level is unbreakable, and the eventual reversal is therefore more decisive. The fading conviction in the third rally is the warning. The progressively smaller bullish bodies during the rally to the third peak signal that buying pressure is exhausting even before the reversal candle forms. This candle-body trajectory reading from Lessons 17, 18, and 21 applies directly to triple top recognition — fading bullish bodies approaching a known resistance level is the structural warning that the pattern is approaching completion.
Notice how the reversal candle at each successive peak became more decisive: shooting star at peak one (suggestive), gravestone doji at peak two (firmer, showing pure indecision at a now-confirmed level), and bearish engulfing at peak three (decisive seller dominance). This progression isn't required for a valid triple top, but it's common because each successive failure at the resistance brings more participants to the conclusion that the level is unbreakable, and the eventual reversal is therefore more decisive. The fading conviction in the third rally — progressively smaller bullish bodies approaching the resistance — is the additional warning that the pattern is approaching completion.
Anatomy of a triple bottom with candle integration
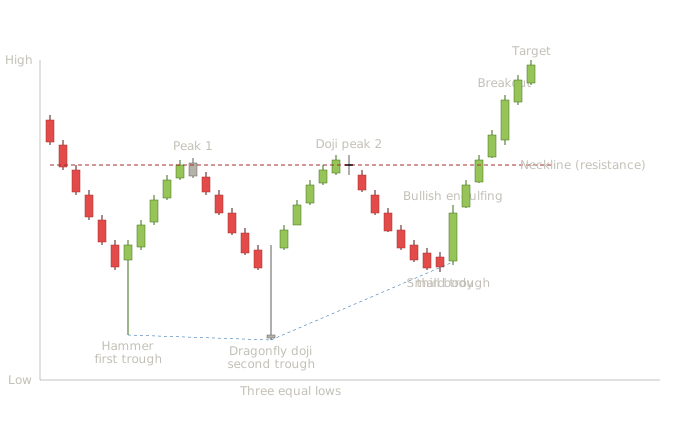
The triple bottom mirrors the triple top structurally and the candle integration follows the same logic at each critical moment. The pattern's psychology is the mirror image: three sequential failed attempts to drive price lower, each marked by a candle-level reversal signal showing buyers absorbing the selling pressure at the same price level.
Six bearish candles establish the prevailing downtrend with consistent moderate bodies. The context the triple bottom will reverse.
Small bullish body sits near the top of an extended lower shadow. From Lesson 3, this is the classical hammer reversal candle — sellers pushed price down hard during the session, but buyers absorbed the selling and pushed the close back up. Location is good (after an extended downtrend), magnitude is meaningful (long lower shadow), and confirmation arrives on subsequent sessions.
Four bullish candles drive price up to what becomes the neckline level. Healthy buying, steady progression.
A small candle marks the first rally's high. The small body shows the rally has paused — buyers ran out of momentum at this level.
Five bearish candles drive price back down toward the prior trough's level. The candles get progressively smaller as the decline approaches the prior trough — fading bearish pressure approaching known support.
The second trough forms with a dragonfly doji — open and close at essentially the same price near the session's high, with an extended lower shadow probing back to the same support level that held price at the first trough. From Lesson 2, this is maximum bullish indecision at support: sellers tried to push lower during the session but couldn't sustain the close at all. The dragonfly doji at the second trough has the same significance as the gravestone doji at the second peak of the triple top — it tells students immediately that the support level is being defended seriously.
Five bullish candles drive price up to test the neckline level a second time. The rally is similar in character to the first.
Indecision at the resistance level — confirms the neckline as real resistance that's being tested twice.
Seven bearish candles drive price back down to test the prior support level a third time. Notice the candles get progressively smaller as the decline approaches the prior troughs — fading bearish conviction, the mirror of what we saw in the triple top's third rally.
Small body shows seller exhaustion approaching the support level.
A long bullish candle opens below the small candle's close and rallies powerfully to engulf its body completely. From Lesson 5, this is the bullish engulfing pattern — and it appears exactly at the third trough's level, completing the triple bottom with decisive candle confirmation.
Three bullish candles drive price toward the neckline. The candles grow progressively larger — accelerating bullish pressure that confirms the bottoming pattern.
A long bullish near-marubozu breaks decisively above the neckline resistance. The body is large, the close is well above the breakout level, the candle confirms the triple bottom's resolution.
Two more bullish candles drive price toward the measured-move target.
Three troughs at approximately the same level, separated by two intervening rallies, with the neckline drawn through the rally highs. The candle signals at each trough mirror the bearish patterns from the triple top: hammers, dragonfly dojis, bullish engulfing patterns at the third trough. The integrated reading follows the same logic in reverse. The triple bottom appears more reliable than the triple top in most cross-pattern studies — Liberated Stock Trader ranks triple bottom at 87% while finding most triple tops underperform. The structural reason is partly that bottoming patterns benefit from broader market dynamics that favor mean reversion after extended declines, while topping patterns face the constant uptrend bias of growth-oriented equity markets.
Pattern statistics and sources
Confirmation rule: Decisive close below the neckline (the horizontal line through the two intervening valleys), ideally with expanding volume. Conservative entry waits for a retest of the broken neckline from below. Volume signature: Volume typically declines across the three peaks (heaviest on the first, lighter on each successive peak), then expands at the neckline breakdown. The declining volume across peaks reflects fading buying enthusiasm at the resistance level. Reliability: Generally regarded as a respected reversal pattern when correctly identified, though triple tops are rare relative to double tops because most twin-peak setups don't develop the third peak before resolving in one direction or another. Common failure mode: Third peak exceeds the prior peaks' level, invalidating the pattern. The market breaks out upward through the resistance line instead of breaking down through the neckline.
Confirmation rule: Decisive close above the neckline, ideally with expanding volume. Volume signature: Volume typically declines across the three troughs (heaviest on the first, lighter on each successive trough), then expands at the breakout. The declining volume across troughs reflects fading selling pressure at the support level. Reliability: Generally regarded as one of the more reliable reversal patterns, with reliability ranking among the highest in many comparative studies. Multiple sources include triple bottoms among the most reliable patterns at 87% success rate, alongside head and shoulders at 89%, double bottom at 88%, and descending triangle at 87%. Common failure mode: Third trough breaks below the prior troughs' level, invalidating the pattern.
| Source | Pattern | Statistic | Notes |
|---|---|---|---|
| Bapital (algorithmic) | Triple top | 41% win rate, 2:1 avg R:R | 1,710 patterns tested. Most reliable on higher timeframes and in trending markets. |
| TradingView community study | Triple top | 77.59% success rate | Multi-pattern analysis of crypto markets. Methodology differs significantly from equity studies. |
| ThinkMarkets (2025–2026) | Triple top | 88% reliability as bearish reversal | Manual identification with structural focus. Highest figure in available research. |
| Liberated Stock Trader | Triple bottom | 87% success rate, +45% avg profit | Decades of trading research. Bull markets only. Pattern described as relatively rare. |
| WallStreetZen (Bulkowski / Hinds) | Triple bottom | 74%–79% success rate | One of the most reliable chart patterns. Around 75% lead to reversal into uptrend. |
| Alchemy Markets | Triple bottom | ~87% | Cites Liberated Stock Trader as source. Notes difficulty identifying correctly in choppy conditions. |
| TradingView community study | Triple bottom | 79.33% success rate | Same crypto-market study as the triple top figure above. |
| thepatternsite.com (Bulkowski) | Both | Reliability rankings, avg moves, throwback frequencies | Primary research source — extensive sample with pull-back and throwback frequency data. |
Triple top reliability ranges from 41% (Bapital's algorithmic detection of 1,710 patterns) to 88% (ThinkMarkets' figure). Triple bottom reliability ranges from 74% to 87% across credible sources. The same methodological factors that drove variance in earlier patterns are at work here: Manual versus algorithmic detection. Bapital's 41% for triple tops uses algorithmic identification; the higher figures from other sources use manual identification where human judgment can favor cleaner patterns. The gap reflects how much identification standards affect reported reliability. How 'success' is defined. Some sources count any breakdown beyond the neckline as success; others require the measured-move target to be reached. The same pattern can look highly reliable under one definition and barely better than chance under another. Market and timeframe. Triple patterns work better in trending markets and on higher timeframes. Sources testing across all conditions and all timeframes get lower aggregate figures than sources that filter for favorable conditions. The triple bottom appears more reliable than the triple top in most cross-pattern studies. This asymmetry is consistent across sources — Liberated Stock Trader ranks triple bottom at 87% while finding most triple tops underperform; multiple ranking lists place triple bottom in the top tier of reliability while triple top sits lower. The structural reason is partly that bottoming patterns benefit from broader market dynamics that favor mean reversion after extended declines, while topping patterns face the constant uptrend bias of growth-oriented equity markets. For your students, the practical takeaway: triple patterns are real patterns with real edges, but the triple bottom carries materially better statistical support than the triple top in most testing methodologies. Students trading triple tops should expect more whipsaws and false breakdowns than students trading triple bottoms, and should size positions accordingly.
thepatternsite.com (Bulkowski) — extensive research on triple tops and triple bottoms with reliability rankings, average post-breakout moves, and pull-back/throwback frequencies. liberatedstocktrader.com — backtests with explicit success-rate figures and average profit potential. bapital.com — algorithmic backtesting with large sample sizes for both pattern variants. wallstreetzen.com — review-style summaries citing Bulkowski and others. alchemymarkets.com — practical trading rules with confirmation requirements. investingoal.com — discussion of pattern strengths and limitations. thinkmarkets.com — recent 2025-2026 research with structural focus. TradingView community research posts — particularly useful for cross-market reliability figures including crypto-specific data.
Combined chart — double bottom into bull flag into failed bear flag into triple top
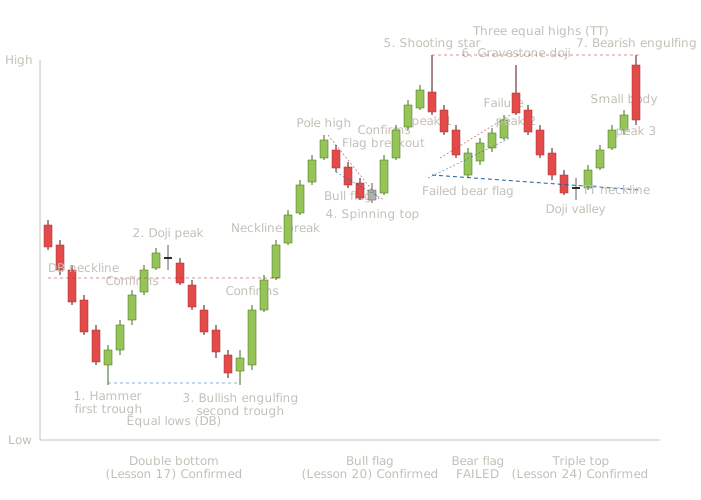
This chart sits at the level your students should be approaching by the time they've worked through the curriculum to this point. Four distinct patterns chain together with seven labeled candle-level identifying signals throughout, plus an explicit failure example showing how non-confirmation looks. Real markets produce sequences like this constantly on every timeframe, and students who can read this chart fluently are reading at the level of working traders.
The seven labeled candle signals are numbered explicitly in the chart so we can walk through each one.
Small bullish body sitting near the top of an extended lower shadow at the bottom of the prior downtrend. From Lesson 3, this is the classical hammer reversal candle. The four-dimension framework reads well: extended downtrend provides good location, long lower shadow provides meaningful magnitude, and the close near the top of the range shows real buyer absorption of the selling. The confirmation note above the subsequent rally tells students this is when the hammer's reversal becomes structurally validated — the next several sessions push higher and don't break below the hammer's low.
The doji marks where the initial recovery rally pauses, defining what will become the double bottom's neckline. From Lesson 2, this is maximum indecision at the rally's high. The doji itself isn't a reversal signal here — it's a structural marker showing where buyers ran out of momentum on the first rally. This level becomes the future breakout target for the double bottom completion.
A long bullish candle opens below the prior small bearish candle's close and rallies powerfully to engulf its body completely. From Lesson 5, this is the bullish engulfing pattern at ideal location — at the prior trough's level, completing the double bottom's second touch of support. The candle-level reader sees a powerful reversal signal in its own right; the chart-level reader sees the second trough of the double bottom completing with decisive candle confirmation. Both views agree, and the explicit confirmation note above the subsequent rally confirms the pattern is now playing out structurally. The neckline break that follows is itself confirmed by the long bullish candle that decisively pushes through the prior resistance level. From the candle-level reading from Lesson 2, this is a near-marubozu breakout candle — minimal upper shadow, large body, close well above the breakout level. Students who waited for this breakout entered with full structural confirmation.
From Lesson 4, the spinning top at the bottom of the flag's pullback shows neither side winning — small body with shadows extending in both directions. This is the equilibrium that often precedes a flag breakout. The flag breakout candle that follows is explicitly labeled as confirming — a long bullish near-marubozu that breaks above the flag's upper trendline with decisive structure. This is one of the most important pedagogical features of this chart: the bull flag is shown as a confirmed pattern because the breakout candle has the right characteristics. Compare this to what we'll see next.
The failed bear flag. After the second leg of the rally reaches a peak with a shooting star, price declines moderately and the structure could form a bear flag — a small upward-sloping consolidation after a downward move that would resolve through a breakdown if confirmed. Notice the structure looks similar to a bear flag at first: small consolidation with mild counter-trend slope, similar candle character to a flag formation. But the pattern fails. Instead of breaking down through the lower flag boundary, price breaks back up through the upper boundary and rallies to a new high. The explicit 'Failure' annotation tells students this pattern did not resolve as expected. A trader who shorted at the first signs of the bear flag forming would have been caught when the pattern failed to confirm.
Up to this point in the curriculum, we've shown patterns playing out cleanly with confirmation candles at the right moments. Real trading produces just as many patterns that look like they're forming but never confirm. Students who only see textbook examples develop unrealistic expectations and find their actual trading frustrating because real markets produce failures constantly. The failed bear flag in this chart teaches the right reading habit: don't act on a pattern's apparent formation; act on its confirmation. The bear flag that didn't break down should never have been traded short. The trader who waits for the breakdown candle never enters this trade because that candle never arrives. The discipline pays for itself by avoiding all the failed-pattern losses that lower-discipline traders accumulate.
Small bearish body sitting near the bottom of an extended upper shadow. From Lesson 3, this is the classical shooting star at the top of a rally. The candle-level reader treats this as a potential reversal signal in its own right; the chart-level reader notes that it's establishing what will become the triple top's resistance level if subsequent rallies reach the same height.
The second peak of the developing triple top forms with a gravestone doji — open and close at the session's low with an extended upper shadow probing back to the same resistance level. From Lesson 2, this is maximum bearish indecision at resistance: buyers tried during the session but couldn't sustain the close at all. This is the signal that confirms the resistance level is being defended seriously. The pattern is now potentially a triple top (if a third peak forms at the same level) or potentially a double top (if the next move breaks down through the neckline).
The pattern's defining confirmation candle. A long bearish candle opens above the prior small bullish candle's close and rallies briefly to the resistance level, then sells off dramatically to close below the small candle's open, engulfing its body completely. From Lesson 5, this is the bearish engulfing pattern at the third peak — the same resistance level that rejected price at peaks one and two, now rejecting it a third time with decisive seller dominance.
The three-peak sequence with progressively more decisive reversal candles (shooting star → gravestone doji → bearish engulfing) shows exactly the candle character progression we discussed in Lesson 24's anatomy section. Each successive failure at the resistance brings more participants to the conclusion that the level is unbreakable, and the eventual reversal candles become more decisive.
The neckline break that completes the triple top is shown by the subsequent bearish candle decline. A trader watching for the neckline break has confirmation that the triple top has resolved structurally.
Several pedagogical lessons compound in this chart. Confirmation versus failure becomes visible. Three of the four patterns confirmed cleanly through their expected candle and structural signals. One pattern (the bear flag) failed to confirm. The chart shows both outcomes side-by-side, which is more honest to real trading than charts showing only successful patterns. Students who internalize this view develop calibrated expectations about pattern reliability rather than expecting every formation to play out. Candle character at each structural moment tells the story. Each labeled candle signal serves a specific purpose: the hammer and bullish engulfing at the troughs identify reversals, the doji marks the neckline, the spinning top within the flag signals equilibrium before breakout, the shooting star/gravestone doji/bearish engulfing sequence at the three peaks shows progressively building distribution. A trader watching only price levels misses these signals; a trader watching only candles misses the structural context. The integrated reader sees both. The seven labeled signals are tradeable in different ways. Aggressive entries can be taken on candle signals alone (the hammer at the first trough, the bullish engulfing at the second trough, the bearish engulfing at the third peak). Conservative entries wait for the structural confirmation that follows (the neckline break of the double bottom, the flag breakout candle, the neckline break of the triple top). Both approaches are valid; the choice depends on a trader's risk tolerance and the specific quality of each signal at each moment. The failure example is the most valuable teaching point. Most curricula skip the failure cases because they're less impressive visually. But experienced traders know that recognizing failure is more important than recognizing success — the failure of a bearish setup tells you the bulls are still in control, and acting on that information often produces better trades than the original setup would have. The bear flag's failure in this chart could itself be a long entry signal for a trader watching closely. The chart sequence covers a complete trend lifecycle. Birth (double bottom), confirmed continuation (bull flag), attempted reversal that fails (bear flag), and successful reversal (triple top). Each phase requires different reading habits, and the chart shows all four phases in sequence. Students who can identify all four phases on a single chart are reading at the level required to trade real markets.
Multi-pattern entry and exit opportunities through this sequence
A trader watching this chart in real time had many decision points. Working through them shows how the integrated reading translates into actual trading decisions:
- At the first trough's hammer. Aggressive long entry on the hammer with a stop below the hammer's low. Small position because the double bottom hasn't yet been confirmed — this is essentially a candle-pattern trade in a downtrend context.
- At the second trough's bullish engulfing. Add to long or initiate long for traders who didn't enter at the first trough. The second trough confirms the support level matters; the bullish engulfing provides the candle-level entry trigger.
- At the double bottom neckline break. Conservative entry for traders who waited for structural confirmation. The neckline break candle provides clear entry with the broken resistance level (now support) as the stop reference.
- At the bull flag breakout. Re-entry or position-adding for the established trend's continuation. The flag breakout candle's structure (long bullish near-marubozu, decisive close above the flag boundary) provides the conviction.
- At the bear flag's potential setup. A trader watching this formation should hesitate to short on the apparent flag structure — wait for the breakdown candle. When the breakdown doesn't come and instead price breaks back up, the failed bear flag becomes a bullish signal in its own right (failed bearish patterns often produce bullish continuations).
- At the triple top's shooting star. Aggressive short with tight stop above the high. Small position because the pattern hasn't yet developed.
- At the triple top's gravestone doji. Add to short or initiate short for traders who didn't enter at peak one. The second peak's reversal candle confirms the resistance is being defended.
- At the triple top's bearish engulfing. Largest short entry — the three-peak pattern is now structurally complete with the most decisive reversal candle of the three peaks. Stop above the third peak; target the measured move from the pattern's height projected below the neckline.
- At the neckline break. Final entry opportunity for traders who waited for full structural confirmation. The pattern has played out completely at this point.
A trader doesn't need to take every entry to do well — choosing two or three high-conviction entries through the sequence based on their personal risk tolerance is what most successful traders actually do. The integrated reading from candles plus charts provides the framework to identify those high-conviction moments rather than relying on intuition.
How students should practice this level of reading
The exercise that consolidates this learning is to pull up daily charts of liquid trending instruments and look for similar multi-pattern sequences with failures included. Real charts will have patterns that confirmed and patterns that failed, in roughly equal numbers. Students should specifically practice identifying failed patterns and noting what the candle signals were doing at the moment of failure — the inability of a 'breakout' candle to close decisively beyond the boundary, the resumption of prior trend candle character within what should have been the new direction, the volume patterns that suggested participation was insufficient.
Students who can identify three real-world examples of multi-pattern sequences including at least one clear failure have crossed an important threshold. They're no longer just identifying patterns that worked in retrospect — they're reading price action with the realistic expectation that some patterns confirm and some fail, and they can distinguish between the two before risk capital.
Common student mistakes with triple tops and bottoms
This is the most common identification mistake. A triple top has three peaks at approximately the same level. A head and shoulders top has the middle peak higher than the other two. Students who don't verify this distinction trade the wrong pattern, applying triple-top rules (horizontal neckline) to what's actually a head and shoulders setup (potentially sloping neckline), or vice versa.
The three peaks (or troughs) should be at approximately the same level, not exactly the same level. A 1-3% variation between extremes is usually fine; insisting on perfect equality means rejecting valid patterns. Students should look for the visual impression that all three peaks reached the same area, not for tick-perfect equality.
A double-top pattern that hasn't yet developed the third peak isn't a triple top — it's still a double top with the possibility of resolving in either direction. Students who anticipate triple tops too early often find themselves short into rallies that actually break out above the resistance, invalidating both the double-top and the anticipated triple-top setups.
Same mistake as with double tops, magnified by the triple top's structural complexity. A triple top forming is not a triple top complete. Until price breaks below the neckline, the pattern can still fail. Students who short on the third peak rather than waiting for the neckline break take on substantial risk.
A rectangle in sideways action looks similar to a triple top when viewed casually. The distinction: triple tops require a prior uptrend leading into the formation; rectangles can form without a clear prior trend. Without the prior uptrend providing structural context, three peaks at the same level are just resistance being tested in a range, not a topping pattern.
This is the new mistake that candle integration teaches students to avoid. A triple top with strong reversal candles at each peak (or progressively stronger candles as we built in the example) is materially stronger than one with random candle behavior at the peaks. Students should specifically look for shooting stars, gravestone dojis, evening stars, or bearish engulfing patterns at each peak. Patterns without these candle-level confirmations are weaker setups.
The first peak might be a temporary stall in an uptrend. The second peak confirms the level matters. The third peak with a strong reversal candle confirms the resistance is unbreakable. Students should weight their conviction accordingly — small position at the first peak's reversal signal, larger position at the second peak's reversal signal, full position at the third peak's reversal signal or the neckline break.
How this lesson connects to what comes next
Lesson 25 covers scallop patterns — the J-shaped continuation patterns discovered and named by Thomas Bulkowski. Scallops come in four variants (ascending and descending, bullish and bearish), each representing a specific market psychology that the patterns we've covered so far don't quite capture. Scallops are particularly useful for students learning to trade in mature trends because they identify the structural pauses that often appear before the trend's final continuation.
Lesson 26 covers pipe tops and pipe bottoms — sharp two-candle reversal patterns that Bulkowski also discovered. Pipes sit at the boundary between candle patterns and chart patterns, and they're particularly important to learn because they often produce strong reversals with very tight stop-loss placement opportunities.
Lessons 27 and 28 then close out the curriculum with the interpretation framework and the synthesis lesson, completing the integrated multi-timeframe approach we've been building since Lesson 14.
Key Takeaways
- Triple patterns are close structural relatives of double patterns — the third touch at the same level makes the structure significantly stronger and the eventual breakout typically produces greater follow-through.
- The critical distinction: triple tops have three peaks at approximately the same level (1-3% variation acceptable); head and shoulders tops have the middle peak higher than the flanking peaks.
- Triple patterns require a prior trend leading in — without the prior uptrend, three peaks at the same level are just sideways resistance testing, not a triple top.
- The candle character progression across three peaks (shooting star → gravestone doji → bearish engulfing) shows escalating seller conviction at the resistance level.
- Fading bullish bodies during the third rally — progressively smaller candles approaching the resistance — is the structural warning that the pattern is approaching completion.
- Triple bottom reliability (74%–87%) is materially higher than triple top reliability (41%–88% with significant downside risk). Students trading triple tops should expect more whipsaws and size positions accordingly.
- Teaching failure is as important as teaching success — the failed bear flag in the combined chart teaches the right reading habit: don't act on apparent formation; act on confirmation.
Quiz — 4 Questions
Answer one at a timeWhat is the critical structural distinction between a triple top and a head and shoulders top?
In this lesson
300 — Western Chart Patterns — Structure, Candle Integration, Statistics