Scallop Patterns
The scallop pattern is one of Thomas Bulkowski's contributions to the Western chart pattern vocabulary, named for its visual resemblance to a scallop shell or the letter J. Scallops are continuation patterns that appear during established trends, marking structural pauses before the trend's resumption. What makes scallops pedagogically distinctive from the other continuation patterns we've covered is their curved structure — unlike triangles (converging straight lines), flags (parallel straight lines), or rectangles (horizontal straight lines), scallops trace a curved formation more similar to rounding patterns from Lesson 18 but appearing within an ongoing trend rather than at a reversal point. The scallop family has four members, and the distinctions matter because each variant reflects a different trend context and produces different reading habits. Students who learn only one scallop variant and apply that template to all four contexts will misread the pattern's implications. The four variants are: ascending scallop (the classic J-shape in an uptrend), descending scallop (the inverted-J in a downtrend), ascending and descending right-angled scallops (variants where the curve is sharper at one end than the other). We'll cover the classic ascending scallop in full detail, then map the structural variants.
- Identify the ascending scallop's J-shape using the body-trajectory symmetry reading habit from Lesson 18
- Distinguish scallops from cup and handle patterns (no handle component, direct breakout from the curve's recovery)
- Distinguish scallops from rounding bottoms (continuation within a trend versus reversal of a trend)
- Read the candle-body trajectory across both sides of the scallop as the primary identification skill
- Identify the four scallop variants (ascending, descending, ascending right-angled, descending right-angled)
- Apply Bulkowski's methodological caution — scallops are real patterns but identification skill matters more than for patterns with clearer structural triggers
Vocabulary
| Term | Definition |
|---|---|
| Scallop | A continuation pattern within an established trend, formed by a curved price decline and recovery (in uptrends) or curved price rally and decline (in downtrends). The shape resembles a scallop shell or the letter J when viewed across the formation. Named and systematically described by Thomas Bulkowski. |
| Ascending scallop | A bullish continuation pattern within an uptrend. Price reaches a high, declines gradually through a curved formation, finds support, then recovers along a curve that eventually exceeds the prior high. The full formation traces a J-shape with the right side of the J higher than the left. |
| Descending scallop | The bearish mirror, appearing within a downtrend. Price reaches a low, rallies gradually through a curved formation, finds resistance, then declines along a curve that eventually exceeds the prior low. The formation traces an inverted-J with the right side lower than the left. |
| Ascending right-angled scallop | A variant where the curve is sharp on the left side and gentle on the right side, creating an asymmetric J where the descent is steeper than the recovery. Bulkowski distinguishes this variant from the symmetric ascending scallop because the asymmetry produces different reliability characteristics and breakout behaviors. |
| Descending right-angled scallop | The mirror variant for downtrends, with sharp rally on the left and gentle decline on the right. |
| Scallop left side | The first half of the formation, descending in ascending scallops and ascending in descending scallops. This side establishes the structural starting point of the pattern. |
| Scallop bottom (in ascending scallops) / scallop top (in descending scallops) | The pivot point at the curve's extreme. In ascending scallops, this is the low point where the gradual decline reverses. In descending scallops, this is the high point where the gradual rally reverses. |
| Scallop right side | The second half of the formation, ascending in ascending scallops and descending in descending scallops. This side completes the pattern's curve and approaches what becomes the breakout (or breakdown) level. |
| Breakout level (for ascending scallops) | The price at the left side's high, which becomes the threshold price must exceed to confirm the pattern's continuation. When price closes decisively above this level, the scallop has resolved bullishly. |
| Breakdown level (for descending scallops) | The mirror — the price at the left side's low, which becomes the threshold for bearish continuation confirmation. |
| Trend requirement | Scallops are continuation patterns and require an existing trend to be valid. A scallop forming in sideways or choppy action isn't really a scallop — it's just curved price action without the directional context that gives the pattern meaning. Students should verify the trend's existence before labeling any curve a scallop. |
| Pattern depth | The vertical distance from the scallop's high (for ascending) or low (for descending) to its opposite extreme. Determines the measured-move calculation and provides one filter for pattern quality — extremely shallow scallops often lack the structural significance to produce meaningful breakouts. |
| Curve quality | A subjective measure of how cleanly the scallop traces an actual curve versus a jagged, irregular path. Clean curves are generally regarded as more reliable signals than messy ones, though 'clean' is in the eye of the beholder. |
Anatomy of an ascending scallop with candle integration
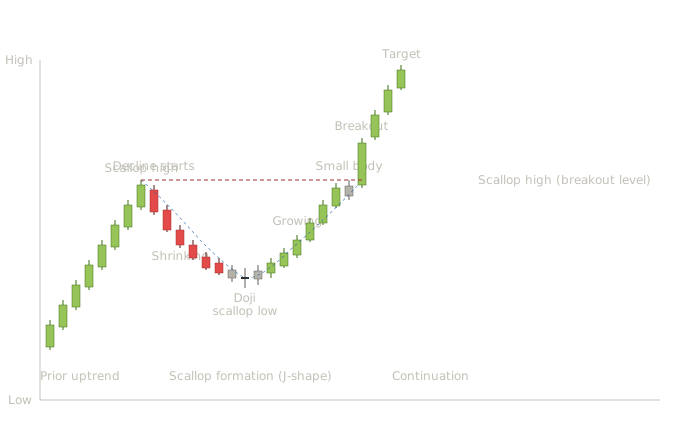
The ascending scallop teaches a specific kind of integrated reading that combines elements students have already learned. The pattern's curve resembles a rounding bottom from Lesson 18, but the structural significance is different — this isn't a reversal of a downtrend, it's a continuation of an uptrend after a brief curved pause. The candle-character reading habits transfer directly, while the trade decision differs.
Eight bullish candles drive price up with consistent moderate bodies, establishing the prevailing trend. Each candle closes near its high with steady progression. This is the trend context the scallop will continue. Without this prior uptrend, the formation that follows would just be a curved consolidation with no continuation expectation.
Price reaches the high that will define the scallop's left side anchor. This is also the breakout level for the eventual continuation — the price the right side of the scallop must exceed to confirm the pattern's resolution.
Seven bearish candles drive price down from the high. From the candle-body trajectory reading habit we've used throughout the curriculum, notice that the bodies start at moderate size and gradually shrink as the decline progresses. This is fading selling pressure rather than accelerating panic — exactly the candle character that signals a rounding-style bottom approaches rather than a V-bottom or sharper reversal.
This body-shrinkage is the most important candle-level reading habit for scallop identification. Scallops form through gradual transitions on both sides. If the decline accelerates with expanding bearish bodies (the way V-bottoms form), what's developing isn't a scallop — it's something else entirely. If the decline maintains consistent bodies throughout (the way symmetrical triangles compress), the formation is more likely a triangle or rectangle. The progressive body-shrinkage is structurally specific to scallops and rounding patterns.
Three small candles appear at the bottom of the curve, including a doji at the center. From Lesson 18's reading of rounding bottoms, this is the canonical signature of a rounding floor — indecision candles marking the gradual transition from selling pressure to neutral to buying pressure. The doji at the scallop's low has the same structural significance it has in rounding bottoms: it marks the moment when the curved decline has exhausted itself and the curved recovery is about to begin. From Lesson 2, the doji with shadows extending in both directions shows neither side won the session — the selling pressure that drove the decline has dissolved into pure indecision before buyers reassert.
Six bullish candles drive price back up toward the prior scallop high. The bodies grow progressively larger as the recovery gains conviction — the mirror image of the left side's gradual decline. This symmetry across the scallop's midpoint is what gives the pattern its rounded shape.
The candle-body symmetry between left side and right side is the second most important reading habit for scallop identification. A proper scallop shows gradual decline with shrinking bodies, then gradual recovery with growing bodies. Asymmetric versions exist (the right-angled variants), but the classic ascending scallop has roughly symmetric body trajectories on both sides.
A small bullish body appears just below the prior scallop high. This is the equilibrium pause that often precedes a meaningful breakout — buyers and sellers have fought to a near-draw just below the resistance level, and the next session's direction will likely be decisive.
A long bullish near-marubozu breaks decisively above the scallop high. The body is large relative to the recent candles, the close is well above the breakout level, the structure shows minimal upper shadow. From Lesson 2, this is the high-quality breakout candle that confirms the scallop's resolution as a bullish continuation. The breakout candle's quality matters significantly. A weak breakout barely clearing the prior high is suspect — scallops with weak breakouts often fail because the pattern's gradual character suggests the market was uncertain throughout the formation, and a weak breakout doesn't introduce the conviction needed for continuation. A strong breakout candle with decisive structure provides the confirmation the gradual scallop formation was missing.
Three more bullish candles drive price toward the measured-move target. The classical measured move for an ascending scallop is calculated by taking the depth of the formation (from scallop high to scallop low) and projecting it upward from the breakout point. Some practitioners use the height of the prior trend's swing instead, depending on which measure provides a more reasonable target given the broader trend's context.
The ascending scallop teaches a specific structural lesson that adds to what students learned in earlier lessons: Curved continuation patterns exist alongside straight-line continuation patterns. Up to this point in the curriculum, the continuation patterns we've covered have all been built from straight trendlines: triangles, flags, pennants, rectangles, wedges. The scallop is the first continuation pattern with a curved structure. Students who've internalized straight-line continuation patterns sometimes miss scallops entirely because they look for trendlines that don't exist in scallop formations. The right reading habit for scallops is to track the candle-body trajectory across the formation rather than looking for trendlines. Scallop reading reuses rounding-pattern habits. Everything students learned about reading rounding bottoms in Lesson 18 transfers directly to reading scallops. The body-shrinkage on the decline, the indecision at the floor, the body-growth on the recovery, the symmetry across the midpoint — all of these are the same reading skills. What changes is the structural context: rounding patterns are reversals (changing the trend's direction), while scallops are continuations (resuming the same trend). The breakout level is the prior swing high, not a calculated target. Unlike rounding bottoms (which use a horizontal neckline drawn through specific peaks), scallops break out through the level of the scallop's own high — the price where the curve's descent began. Students should specifically mark this level when identifying a scallop because it becomes the trade trigger. Volume signature matters significantly. Healthy ascending scallops show declining volume during the decline, low volume at the curve's floor, and expanding volume during the recovery, with a clear volume surge at the breakout. The U-shape volume profile across the scallop combined with the spike at breakout is the volume signature students should look for.
The four scallop variants
The classic ascending scallop covered above is the most common variant, but Bulkowski distinguished three additional variants worth understanding.
The bearish mirror, appearing in downtrends. Price reaches a low, rallies through a curved formation, finds resistance, then declines along a curve that exceeds the prior low. The shape resembles an inverted-J. The candle character reads mirror to ascending: gradual bullish bodies shrinking on the way up, indecision at the curve's top, gradual bearish bodies growing on the way down, decisive breakdown candle below the scallop low.
A variant where the left side is steeper than the right side, creating asymmetry. The decline portion happens quickly (steep, fast bearish move), but the recovery portion happens gradually (slower, curved bullish move). This asymmetry typically reflects sharp profit-taking on the decline followed by patient accumulation on the recovery. The right-angled variant has slightly different reliability characteristics from the symmetric version and tends to appear after particularly strong prior moves where the initial profit-taking is more aggressive than the eventual continuation buying.
The bearish variant with mirror asymmetry — steep rally on the left side (sharp short-covering after a downtrend), then gradual decline on the right (patient distribution).
Pattern statistics and sources
Confirmation rule: Decisive close above the scallop's high (the left side's starting price), ideally with expanding volume. Conservative entry waits for retest of the broken high from above; aggressive entry takes the breakout candle close. Volume signature: Healthy ascending scallops show declining volume during the left side decline, low volume at the curve's floor, and expanding volume during the right side recovery, with a clear volume surge at the breakout. Reliability: Generally regarded as a moderately reliable continuation pattern with reasonable break-even rates, though Bulkowski himself noted that scallops are excluded from some of his broader studies because of difficulty determining breakout location. Common failure mode: Pattern breaks downward through the scallop low instead of upward through the scallop high. Right side recovery stalls before reaching the prior high. Cited statistics: Bulkowski's research reports that ascending scallops break out upward 83% of the time in bull markets. Bulkowski's data on inverted and ascending scallops (the right-angled variant) is based on 1,776 perfect trades, with the variant performing well in both bull and bear markets, characterized by a low break-even failure rate and large average rise. Overall performance rank is 14 out of 39 patterns.
Confirmation rule: Decisive close below the scallop's low (the left side's starting price), ideally with expanding volume. Volume signature: Mirror of ascending — declining volume during the rally, low volume at the curve's peak, expanding volume during the right-side decline. Reliability: Generally regarded as comparable to ascending scallop in mirror, though continuation patterns in downtrends tend to perform slightly worse than continuation patterns in uptrends due to broader market upward drift. Common failure mode: Pattern breaks upward instead of downward, often producing sharp short-covering rallies. Right side decline stalls before reaching the prior low. Cited statistics: Bulkowski's data on inverted and descending scallops is based on more than 1,500 perfect trades. The pattern's overall performance rank is 9 out of 39 (for up breakouts) and 10 out of 36 (for down breakouts). Break-even failure rates are 16% for up breakouts and 17% for down breakouts. The pattern is described as a robust performer in bull markets. Methodological caution from the original researcher Bulkowski himself notes in his research that scallops (all four varieties) were excluded from some of his broader pattern comparison studies because of difficulty in determining where the breakout actually occurs. This is an important methodological honesty: even the pattern's discoverer acknowledges the identification challenges that make systematic testing harder than for patterns with clearer structural triggers.
Scallop reliability figures cluster more tightly than for most other patterns we've covered, with most credible sources reporting 80%+ break-even rates for ascending scallops in bull markets. This tighter clustering reflects a few factors: Scallops are less commonly tested than major patterns. Fewer independent researchers have published reliability figures for scallops compared to head and shoulders or double tops, partly because the patterns are less iconic and partly because (as Bulkowski himself notes) the identification difficulty makes systematic testing harder. Bulkowski's research dominates the published statistics. Because scallops were systematically described by Bulkowski himself, most published statistics derive from his testing rather than from independent verification across multiple methodologies. Students should treat the figures with the understanding that they come primarily from one research methodology rather than from a cross-source pool. The methodological honesty matters. Bulkowski's own exclusion of scallops from his broader comparison studies tells students something important — even an expert in the patterns acknowledges identification challenges that make systematic testing imperfect. This is the kind of methodological honesty students should look for when evaluating any pattern research. For your students, the practical takeaway: scallops are real patterns with real edges when correctly identified, but the identification skill matters even more than for patterns with clearer structural triggers. A trader who can identify clean scallops with proper curve symmetry, appropriate body trajectories, and strong breakout candles will get results consistent with the high reliability figures. A trader who labels any curved price action a scallop will get results closer to chance because most curved formations aren't actually scallops in Bulkowski's strict sense.
thepatternsite.com (Bulkowski) — the primary source for systematic scallop research, with separate entries for ascending scallops, descending scallops, inverted ascending scallops, and inverted descending scallops, each with reliability figures, average post-breakout moves, and pull-back/throwback frequencies. Bulkowski's Encyclopedia of Chart Patterns — the definitive reference where scallops were originally documented systematically. TradingView community research — useful for cross-checking scallop identifications in real-time charts across different markets. Academic literature via Google Scholar — search "scallop chart pattern" or "rounded continuation pattern" — fewer academic studies of scallops exist than for major patterns. Note for students: because Bulkowski's research dominates the published statistics for scallops more than for any other pattern in our curriculum, students should specifically seek out his work as the primary reference rather than relying on aggregator sites that may quote his figures without proper attribution.
Combined chart — rounding bottom into rising wedge breakdown into ascending scallop
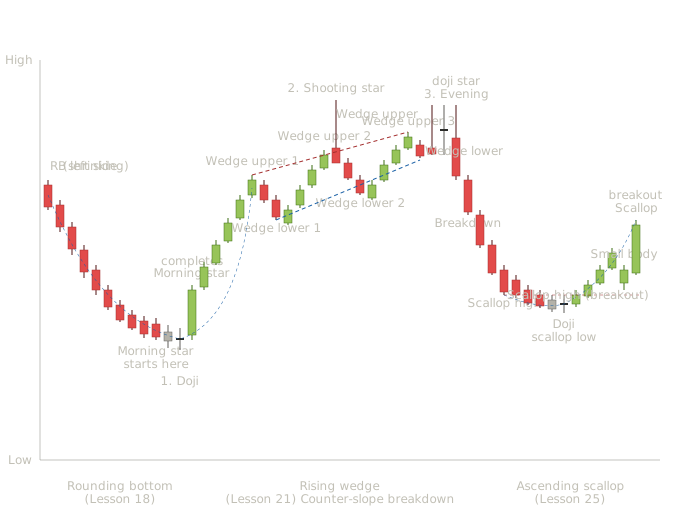
This sequence demonstrates a complete trading cycle that students will see frequently on real charts: a gradual reversal launches an uptrend, the uptrend exhausts through a structurally significant warning pattern that breaks against its slope direction, and a curved continuation pattern then establishes the next leg up. Three explicit named candle patterns plus several supporting candle signals make the integrated reading visible throughout.
Six bearish candles drive price lower with progressively shrinking bodies. From the candle-body trajectory reading habit established in Lesson 18, the shrinking bodies signal fading selling pressure rather than accelerating panic. This is the gradual decline that produces a rounding bottom rather than a V-bottom. Students who watched only price would see "price keeps falling." Students who watched candle bodies would see "selling pressure is fading even as price makes new lows."
Three small candles mark the floor — small body, doji at the center (labeled signal 1), small body. From Lessons 2 and 18, the doji at the curve's floor is the canonical signature of a rounding bottom — maximum indecision at the moment when selling pressure has exhausted and buying hasn't yet asserted. The three-candle cluster forms the structural floor that gives the rounding bottom its curved shape.
Here's where the integration becomes powerful. The doji at the floor isn't just a rounding bottom signal — it's also the middle candle of a morning star pattern from Lesson 7. Look at the three-candle sequence: small bearish body (candle 9), doji (candle 10), long bullish body (candle 11). That's the textbook morning star structure: bearish-then-indecision-then-bullish, with the third candle pushing decisively back into the first candle's body.
The morning star at the floor of the rounding bottom is the kind of multi-layer signal that gives skilled traders high conviction. The chart pattern reader sees a rounding bottom completing its curved transition; the candle pattern reader sees a morning star reversal signal at extreme location with strong magnitude; and the integrated reader sees both confirming each other at the same moment. From the four-dimension framework in Lesson 11, every dimension passes simultaneously: location (extended prior downtrend, at the curve's floor), magnitude (long bullish third candle), confluence (chart pattern plus candle pattern aligning), and confirmation (the subsequent candles continue higher).
Five bullish candles drive price up through the right side of the rounding bottom and into what becomes the rising wedge formation. The bodies are healthy moderate sizes, showing real buyer participation in the recovery. The breakout from the rounding bottom would have been confirmed once price exceeded the prior swing high; from this point forward we're watching the new uptrend develop.
After the recovery establishes wedge upper 1 (the first higher high), a small pullback to wedge lower 1 marks the first lower trendline anchor. The pullback is contained — small bearish bodies, not aggressive. Already this sets up the wedge structure: rising highs and rising lows, but with the lows rising faster than the highs.
Four bullish candles drive price to a higher high. Notice the bodies are similar in size to the prior rally — buyers are still in control but not yet showing diminished conviction.
This is where the rising wedge starts revealing its character. The candle at wedge upper 2 isn't a clean bullish session — it's a shooting star from Lesson 3. Small bearish body sitting near the bottom of an extended upper shadow. Buyers pushed price aggressively higher during the session but couldn't hold the gains; sellers responded with conviction. The shooting star within a rising wedge is significant pedagogically. Where most rising wedges produce smaller and smaller bullish bodies as they progress (the candle-body shrinkage we discussed in Lesson 21), a shooting star at one of the wedge's peaks shows that the rejection at each successive high isn't just gradual exhaustion — it's active selling pressure emerging at the resistance. A trader watching only the wedge structure would expect the typical breakdown; a trader watching both layers sees explicit confirmation that the wedge's bearish bias is being validated by candle-level seller dominance.
Three bearish candles drive price down to the second lower trendline touch. The decline is shallow — wedge lower 2 sits only slightly above wedge lower 1, confirming the lower trendline is rising faster than the upper trendline. The wedge structure is now clearly identifiable.
Four bullish candles drive price to a marginal new high. Look at the candle bodies — they're progressively smaller than the bodies during the rally to upper 2. This is the canonical candle-body trajectory of a rising wedge: each successive rally produces less buying force, even as price reaches marginal new highs.
Watch the three-candle sequence carefully: a long bullish candle making the wedge upper 3 high (candle 31), then a doji at the same level (candle 32), then a long bearish candle that drops back into the bullish candle's body (candle 33). From Lesson 7, that's the textbook evening doji star — the doji-variant of the evening star pattern, generally considered slightly more reliable than the standard evening star because the middle candle is sharper indecision. The evening doji star at the rising wedge's apex is exactly the kind of confluence that gives skilled traders conviction to short. The chart pattern reader sees a rising wedge approaching its apex with the counter-slope resolution that defines the pattern; the candle pattern reader sees an evening doji star at a high after an extended rally; the integrated reader sees both layers agreeing that the trend is exhausted. Multiple dimensions of analysis pointing at the same conclusion simultaneously.
Four long bearish candles drive price decisively below the wedge's lower trendline. The breakdown candles are large-bodied near-marubozu — minimal counter-direction shadows, decisive close below the broken support. This is the counter-slope resolution that defines rising wedge behavior: despite both trendlines sloping upward, the pattern breaks downward because the structural compression made the breakdown inevitable. A trader who entered short at the evening doji star at the apex now has a substantial winning position. A trader who waited for the wedge's lower trendline break has confirmation that the structural breakdown has occurred. Both entries had different risk-reward characteristics but both work because the multi-layer signals confirmed the move.
Three bearish candles continue the decline before exhausting. The bodies get progressively smaller — the same body-shrinkage we saw at the rounding bottom's left side, but here it's happening within a much shorter formation. This shrinkage signals that the wedge's breakdown momentum is fading, setting up the scallop formation.
The decline pauses here at what becomes the scallop's high — the structural anchor that establishes the breakout level for the eventual continuation.
Four small bearish candles drive price down through the left side of the scallop with progressively shrinking bodies. The decline is gradual and contained — exactly the candle character that signals a scallop is forming rather than a sharper reversal pattern.
Two indecision candles mark the scallop's low: a small spinning top followed by a doji. From Lessons 2 and 25, this is the canonical signature of a scallop's curved floor — indecision as the gradual decline transitions to gradual recovery. The doji here serves the same structural function as the doji at the rounding bottom's floor: marking the moment when one regime ends and another begins.
Four bullish candles drive price back up toward the scallop's high. The bodies grow progressively larger — the mirror of the left side's gradual decline. This body-trajectory symmetry across the scallop's midpoint is the visual feature that confirms the formation is a proper scallop rather than a random curve.
A small bullish body appears just below the scallop's high — the equilibrium pause that often precedes a meaningful breakout. From Lesson 4, this small body shows the rally has paused approaching the breakout level, with buyers and sellers fighting to near-equilibrium before the resolution.
A long bullish near-marubozu breaks decisively above the scallop's high. The body is dramatically larger than the recent compressed candles, the close is well above the breakout level. This is the high-quality breakout candle that confirms the scallop's resolution as a bullish continuation. The trend that the wedge's breakdown had interrupted is now resuming through the scallop's structural pause.
Several pedagogical lessons compound in this chart: Three named candle patterns at three structural moments. The morning star at the rounding bottom's resolution, the shooting star at the rising wedge's failing peak, and the evening doji star at the wedge's apex each serve as identifiable named patterns from earlier lessons appearing at exactly the structural moments where chart patterns predict they should appear. Students who can identify each of these three named patterns on their own can name what they're seeing rather than just reading abstract candle behavior. The named patterns give the integrated reading specific terminology. The wedge's counter-slope resolution is the trickiest pattern to read. Most students learning chart patterns expect breakouts to follow the prior trend's direction. The rising wedge defies that expectation — both trendlines slope upward but the pattern resolves downward. Students who haven't internalized Lesson 21's reading habits will misread the wedge as continued bullish action and get caught in the breakdown. The shooting star within the wedge and the evening doji star at its apex are the candle-level signals that confirm the wedge's bearish bias is being validated by candle-level seller pressure — they're the warnings that the breakdown is coming. The scallop completes the cycle by establishing the next trend leg. After the wedge breakdown, students might expect a continued decline or a sustained reversal pattern. Instead, the scallop's curved formation shows a brief gradual consolidation followed by trend resumption. This is structurally important because real markets often produce these short-cycle reversals where a trend pauses through a small reversal pattern, breaks down briefly, and then resumes through a continuation pattern at the higher timeframe view. The scallop's role here is to mark the structural pause before the continuation, not to reverse the broader trend that the rounding bottom had originally established. Body-trajectory reading transfers across all three patterns. The candle-body shrinkage we tracked at the rounding bottom's left side appeared again at the wedge's rallies (fading bullish conviction) and again at the scallop's left side (gradual decline). The body-growth on the right sides of the rounding bottom and the scallop also reappeared. This is the most transferable reading skill in the entire curriculum — once students can track body trajectory across a formation, they can recognize gradual patterns regardless of which specific pattern they're forming. The multi-layer signals at the wedge's apex provide tradeable conviction. The shooting star within the wedge plus the evening doji star at the apex plus the structural breakdown candle together provide three sequential entries for short positions. Aggressive at the shooting star (still developing, requires conviction), moderate at the evening doji star (confluence between candle and chart), conservative at the breakdown candle (full structural confirmation). Each entry has different risk-reward characteristics but all are valid because the multi-layer signals confirm the move.
A trader watching this chart in real time had multiple decision points across the sequence. Working through them shows how the three named candle patterns combined with the chart patterns translate into specific trading decisions:
- At the morning star at the rounding bottom's floor. Long entry with high conviction. Stop below the morning star's low. The three-candle pattern provides the timing while the rounding bottom provides the structural context. This is aggressive entry — the rounding bottom hasn't yet been confirmed by a breakout above the prior swing high — but the morning star at extreme location justifies the conviction.
- At the rounding bottom's eventual breakout above the prior swing high. Conservative add-to-long for traders who waited for full structural confirmation. The morning star's prediction has now been validated by price breaking above the prior trend's high.
- At the shooting star within the rising wedge. Profit-take partial long positions. Don't go short yet because the wedge hasn't broken down — but the shooting star within the developing wedge is a warning that the trend is approaching exhaustion.
- At the evening doji star at the wedge's apex. Short entry with high conviction. Stop above the evening doji star's high. The three-candle pattern at the wedge's apex provides specific timing for the counter-slope breakdown that the rising wedge predicts. This is one of the highest-quality short setups in the entire chart.
- At the wedge's structural breakdown. Conservative short entry for traders who waited for full structural confirmation. The evening doji star's prediction has now been validated by the breakdown candle through the wedge's lower trendline.
- At the doji at the scallop's floor. Long entry with moderate conviction for traders willing to anticipate the scallop's resolution. The doji marks the curve's floor; the gradual decline that preceded it shows the body-shrinkage characteristic of scallop formations.
- At the scallop's breakout candle. Conservative long entry for traders who waited for the full scallop pattern to confirm. The decisive breakout candle above the scallop's high validates the continuation thesis.
A skilled trader doesn't need to take every entry. Choosing two or three high-conviction entries through the sequence is what most successful traders actually do. The integrated reading provides the framework to identify those high-conviction moments rather than relying on intuition.
What makes this chart particularly valuable pedagogically is that students can name what they're seeing at each critical moment. They're not just identifying "a reversal candle at the bottom" — they're identifying a morning star. They're not just seeing "a rejection at the high" — they're seeing a shooting star. They're not just observing "exhaustion at the wedge's apex" — they're observing an evening doji star. This specific terminology matters because it lets students communicate their analysis precisely. A trader who says "I'm long because there was a morning star at the bottom of a rounding pattern with confirming volume" is making a much more precise statement than one who says "I'm long because it looked like it might go up." The named patterns are the currency of trading discussion — they're how traders share analysis with each other and how individual traders develop confidence in their own reading. The full curriculum builds toward this kind of precise integrated reading. Students who can identify three named candle patterns at three structural chart pattern moments on a single chart are reading at the level required for working trading. The synthesis lesson at the curriculum's end will formalize this approach as a complete methodology, but the practical capability is being built right here through these multi-pattern combined charts.
Common student mistakes with scallop patterns
Real scallops have specific structural requirements — they must form within an established trend, show appropriate body-trajectory symmetry, and have the right side reach approximately the level of the left side's starting point before breakout. Random curved price action without these characteristics isn't a scallop; it's just curved price action.
Scallops are continuation patterns and require a prior trend. A curved formation in sideways or choppy action isn't a scallop because there's no trend to continue. Students should verify the trend's existence before labeling any curve a scallop.
Cups and scallops share a curved structure, but cups have an additional handle component (a small consolidation before breakout) while scallops break out directly from the curve's recovery. Cups also typically appear at the end of consolidations after substantial prior gains, while scallops appear within ongoing trends as structural pauses. The distinction matters because the patterns have different measured-move calculations and different volume signatures.
Rounding bottoms (Lesson 18) are reversal patterns that change the trend's direction; scallops are continuation patterns that resume the prior trend's direction. The candle-reading habits are similar but the structural significance is opposite. Students should always check the trend context before deciding whether a curved formation is a rounding bottom or a scallop.
The scallop's gradual character can mislead students into entering long during the right side's recovery, before the breakout above the prior high has confirmed. Aggressive entries during the recovery can work but they require accepting the risk that the recovery might stall before reaching the breakout level. The disciplined entry waits for the breakout candle's confirmation.
Because scallops form through gradual transitions, their breakouts especially benefit from decisive candle confirmation. A weak breakout barely clearing the prior high often becomes a false breakout because the pattern's gradual character provides little structural support for the breakout's continuation. Students should specifically wait for strong-bodied breakout candles before treating a scallop as confirmed.
The U-shape volume profile across the scallop combined with the breakout volume spike is more important for scallops than for many other patterns because the pattern lacks the sharp structural triggers of head and shoulders or double tops. Without the right volume signature, the scallop's reliability drops significantly.
The four scallop variants have different reliability characteristics and different breakout behaviors. Students who don't distinguish between them apply the wrong measured-move calculations and risk-reward expectations to the variants. The right-angled scallops specifically require recognition that one side is steeper than the other, which affects the measured move's projection.
How this lesson connects to what comes next
Lesson 26 covers pipe tops and pipe bottoms — sharp two-candle reversal patterns that sit at the boundary between candle patterns and chart patterns. Pipes are particularly important to learn because they often produce strong reversals with very tight stop-loss placement opportunities, and they appear frequently on weekly charts which makes them especially valuable for position traders and swing traders.
After Lesson 26, the chart pattern vocabulary will be completely covered. Lessons 27 and 28 then build the chart pattern interpretation framework (parallel to Lesson 12 for candles) and the synthesis lesson where candle and chart analysis come together formally as a complete methodology.
Key Takeaways
- Scallops are Thomas Bulkowski's contribution — curved continuation patterns within established trends, resembling a scallop shell or the letter J, appearing as structural pauses before the trend's resumption.
- The most important reading habit: progressive body-shrinkage on the left side (gradual decline) and body-growth on the right side (gradual recovery). This symmetry distinguishes true scallops from random curved price action.
- The breakout level is the prior swing high (the left side's starting price), not a calculated target — the right side must reach and exceed this specific price for the scallop to confirm.
- Four variants exist: ascending scallop, descending scallop, ascending right-angled scallop (steep left, gentle right), and descending right-angled scallop (steep right, gentle left). Each has different reliability characteristics.
- Critical distinction from rounding bottoms: both patterns have curved structures and similar candle reading habits, but rounding bottoms are reversals (changing trend direction) while scallops are continuations (resuming the prior trend).
- Bulkowski's methodological honesty: even the pattern's discoverer excluded scallops from some broader comparison studies because identification difficulty makes systematic testing harder. Identification skill matters more for scallops than for patterns with clearer structural triggers.
Quiz — 3 Questions
Answer one at a timeWhat is the most important candle-level reading habit for correctly identifying an ascending scallop?
In this lesson
300 — Western Chart Patterns — Structure, Candle Integration, Statistics