Rounding Tops, Rounding Bottoms, and V-Shaped Reversals
The reversal patterns we've covered so far — head and shoulders, double tops and bottoms — share a common structural feature: they reverse through clearly defined peaks and troughs separated by intervening price moves. The patterns in this lesson reverse differently.
Rounding Tops, Rounding Bottoms, and V-Shaped Reversals
The reversal patterns we've covered so far — head and shoulders, double tops and bottoms — share a common structural feature: they reverse through clearly defined peaks and troughs separated by intervening price moves. The patterns in this lesson reverse differently. Rounding patterns reverse through gradual, curved transitions where no single peak or trough stands out. V-shaped reversals reverse through violent, sudden directional changes where the turning point is a single session or a very small cluster.
These two categories sit at opposite ends of a reversal speed spectrum. Rounding patterns are slow and patient — they take weeks or months to develop on daily charts and represent a gradual shift in market sentiment. V-shaped reversals are fast and decisive — they happen in a single session or a few sessions and represent sudden capitulation or panic. Both produce reversals, but the trader's approach to each is quite different.
Vocabulary
| Term | Definition |
|---|---|
| Rounding top | A bearish reversal pattern that forms when an uptrend gradually loses momentum, transitions through a curved high, and gives way to an emerging downtrend. The shape resembles an inverted bowl or a frown when viewed across the full formation. There's no single dominant peak — instead, price oscillates near the highs while making slightly lower and lower swings before declining. |
| Rounding bottom (saucer bottom) | The bullish mirror. A downtrend gradually loses momentum, transitions through a curved low, and gives way to an emerging uptrend. The shape resembles a bowl or a smile. Often called a "saucer bottom" in older technical analysis literature, particularly when the curve is broad and shallow. |
| V-top | A sharp, sudden reversal at the top of an uptrend. Price rallies into a high, then reverses violently within a single session or a small cluster of sessions. Unlike head and shoulders or double tops where structural confirmation develops over weeks, the V-top reversal is essentially complete by the time it's identifiable. |
| V-bottom | The bullish mirror. A sharp, sudden reversal at the bottom of a downtrend, often associated with capitulation events, panic selling that exhausts itself in a single session, or news-driven sentiment shifts. |
| Capitulation | The market-psychology event where the last holders of a position give up simultaneously, producing a violent move that often marks the end of the trend rather than its continuation. Capitulation lows in downtrends are frequently the structural bottoms of V-reversals. |
| Climax volume | The exceptionally heavy volume that often accompanies V-reversal turning points. Capitulation events produce massive participation in a short time window, and that volume signature is one of the best confirmations that a V-reversal has occurred. |
| Curve quality | A subjective measure of how cleanly a rounding pattern traces an actual curve versus a jagged, irregular path. Clean curves are generally regarded as more reliable signals than messy ones, though "clean" is in the eye of the beholder. |
Anatomy of a Rounding Bottom with Candle Integration
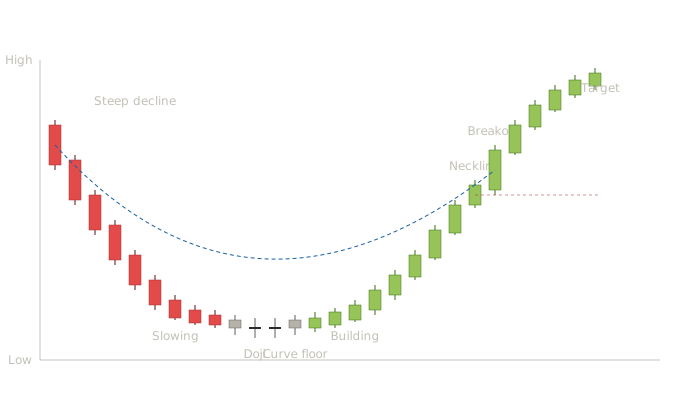
Reading the rounding bottom through both layers This is where the rounding pattern becomes interesting pedagogically — it's the chart pattern that most rewards candle-level reading, because the structural transition is so gradual that without candle-level signals, students often miss the bottom entirely. The steep decline phase (candles 1-5). Five long bearish candles drive price down with substantial bodies and meaningful range. This is the prevailing downtrend — strong selling pressure with conviction. Each candle closes near its low, indicating sellers controlled each session decisively. The downtrend looks healthy here; nothing suggests imminent reversal. The slowing phase (candles 6-8). Notice what happens next: the bearish candles continue, but their bodies get progressively smaller. The candle bodies shrink from large to medium to small over a span of three sessions. This is the structural shift that begins the rounding process — sellers are still in control, but each successive session shows less conviction than the last. From Lesson 2's vocabulary, the candles are shifting from long-bodied toward short-bodied, which signals that the directional pressure is fading even though the direction itself hasn't yet changed. A student reading only candle patterns would notice these progressively smaller bodies as a warning sign. A student reading only chart patterns wouldn't yet see the rounding bottom forming — it takes several more sessions before the curve becomes visible. The candle-level reading is what flags the early shift. The curve floor (candles 9-12). Price enters the bottom of the curve. Notice the candle composition here: small gray candles (spinning tops from Lesson 4), then two consecutive dojis from Lesson 2. The dojis are the most important signal in the entire formation. After a sustained downtrend, the appearance of dojis means open equals close — neither side is winning the session. The seller dominance that drove the prior decline has dissolved into pure indecision. This is where students learn the key reading for rounding bottoms: the floor of the curve is marked by indecision candles, not reversal candles. Unlike a double bottom (which often shows a clear bullish reversal candle at the second trough) or a head and shoulders (which shows specific reversal candles at the right shoulder), the rounding bottom transitions through indecision rather than through decisive reversal. The dojis at the curve's floor are doing what a hammer or bullish engulfing would do in a sharper pattern — they're marking the end of the downtrend — but they're doing it gradually rather than dramatically. The building phase (candles 13-17). Small bullish candles begin to appear, then progressively larger bullish candles emerge. The mirror of the slowing phase: where the decline ended through progressively smaller bearish candles, the recovery begins through progressively larger bullish candles. Each successive bullish session shows more conviction than the last. The pattern's right side mirrors its left side structurally, just inverted. Approaching the neckline (candles 18-19). The bullish candles continue growing as price approaches what will become the breakout level — the high reached during the early stages of the decline before the curve began. The candles here are full-sized bullish bodies, equivalent in magnitude to the bearish bodies that started the formation. Symmetry across the pattern's midpoint. The breakout candle. A long bullish candle breaks decisively above the neckline level. This is the breakout from a structural perspective and a near-marubozu from a candle perspective — minimal upper shadow, body spanning a large range, clear one-sided buyer control during the breakout session. The candle from Lesson 2 confirms the chart pattern from Lesson 18. The continuation toward target. Several more bullish candles drive price higher toward the measured-move target. The target for a rounding bottom is calculated as the vertical distance from the neckline to the bottom of the curve, projected upward from the breakout point — similar to head and shoulders or double bottom measured moves.
The rounding bottom teaches a specific reading habit that's different from the sharper reversal patterns: watch for gradual transitions, not sharp turning points. Students trained only on head and shoulders or double bottoms often miss rounding patterns entirely because they're looking for a specific reversal candle at a specific level. Rounding patterns don't provide that. Instead, they provide a sequence of progressively smaller bearish candles, then indecision, then progressively larger bullish candles. The signal isn't any individual candle — it's the trajectory of candle sizes across the formation. This is a more advanced candle reading habit than the simple pattern recognition from Lessons 1-13. It requires students to track how candles are evolving over time rather than to identify specific named patterns at specific moments. The good news: this habit transfers to many other situations beyond rounding patterns. Students who learn to read candle-body trajectory can often identify trend exhaustion in trends that don't form named patterns at all — they see momentum fading through the candle sizes before any structural pattern appears.
Anatomy of a V-Bottom with Candle Integration
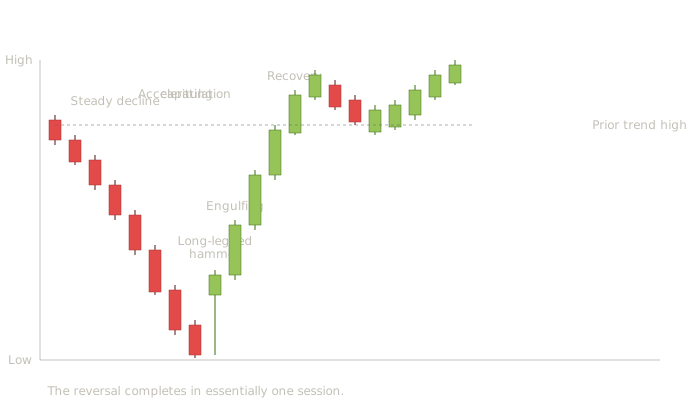
Reading the V-bottom through both layers The V-bottom is essentially the opposite of a rounding bottom in every dimension. Where rounding patterns transition through gradual change and indecision, V-bottoms transition through violent capitulation and explosive reversal. The candle-level reading reveals the difference clearly. The steady decline phase (candles 1-4). Four bearish candles of moderate size establish the prevailing downtrend. Each candle has a meaningful body, each closes near its low, and the progression is steady — not yet panicked. This looks like a normal downtrend, which is exactly what it is up until the next phase begins. The accelerating phase (candles 5-7). Notice the candle behavior change. Bodies get progressively larger, not smaller. This is the opposite of what we saw in the rounding bottom's slowing phase. Where rounding patterns show fading conviction through shrinking bodies, V-reversals show building panic through expanding bodies. Each successive session shows more aggressive selling than the last. From the candle vocabulary, the candles are moving from medium-bodied toward long-bodied bearish marubozu territory — minimal lower shadows, maximum range, decisive seller control. This is the early warning of a V-reversal rather than a normal continuation. Accelerating bearish candles in an established downtrend often signal that capitulation is approaching, not that the decline is healthy. A student trained to read candle-body trajectory recognizes the difference: trends that are sustainable show steady or gradually shrinking candles as they extend; trends that are about to capitulate show expanding candles as the final wave of selling crashes through whatever remaining buyers were holding. The capitulation candle. The eighth candle is the climax — a long bearish session driving price to a new low with a large body and minimal lower shadow. This is what capitulation looks like in candle form: maximum seller pressure, maximum range, sellers completely in control. On a real chart, this candle would typically be accompanied by exceptionally heavy volume — the climax volume that confirms a V-reversal is occurring. This candle alone could be many things — the start of an even larger decline, a normal continuation. The candle-level reading doesn't tell us yet which it will be. We need to see what happens next. The long-legged hammer at the V-low. This is the structural turning point. The next candle opens near the prior session's close, drops to a new low during the session (creating a long lower shadow), then rallies powerfully to close near its high. The body is small relative to the lower shadow, and the close is well above the open. This is essentially a long-legged hammer from Lesson 3, but on steroids — the lower shadow is exceptionally long because the session probed deep into the panic before reversing. The reading here is decisive. Sellers pushed price even lower during this session, but buyers absorbed every bit of the selling and rallied price back above the open. The entire intraday range was a battle that buyers won decisively. From the candle interpretive framework: this is a powerful bullish reversal candle with maximum magnitude and ideal location (at a capitulation low). The four-dimension quality check passes on all dimensions simultaneously. The bullish engulfing follow-through. The next candle opens slightly below the hammer's close, then rallies to engulf the hammer's body completely with a long bullish body. This is the bullish engulfing pattern from Lesson 5 appearing immediately after the hammer. Two reversal candle patterns stacked back-to-back at the V-low — exactly what students should look for as confirmation of a sharp reversal. The explosive recovery (candles 10-13). Four consecutive long bullish candles drive price upward at speed. The pace matches the pace of the prior decline — what went down quickly comes back up quickly. This is one of the signature features of V-reversals: the recovery often mirrors the decline in both magnitude and pace. The chart looks like a V because the right side of the formation moves at roughly the same rate as the left side. Notice the candles during this recovery: long bullish bodies, minimal upper shadows, near-marubozu structure. Buyers are in complete control of each session. This is the mirror image of the accelerating panic that preceded the capitulation — instead of building selling pressure, we now have building buying pressure. The brief pullback (candles 14-16). A small two-candle bearish pullback appears mid-recovery, then immediately resumes higher. This is normal — even violent recoveries see brief pauses for breath. The pullback's small magnitude relative to the recovery's overall move signals that the reversal hasn't lost steam. The completion (candles 17-19). Price approaches the level where the original decline began, completing the V-shape. The recovery has retraced essentially the entire decline that preceded the capitulation. This is what makes the pattern a V — the right side of the formation reaches roughly the same height as the left side started from.
V-reversals teach a fundamentally different reading than rounding patterns. The contrast is stark: Rounding bottoms reverse through fading momentum — bearish candles get smaller, then indecision dominates, then bullish candles slowly emerge and grow. The reversal is patient and gradual. V-bottoms reverse through exhausted momentum — bearish candles get larger and more panicked, then a single capitulation event creates a reversal candle (typically a hammer or hammer-like structure), then bullish candles emerge immediately and grow rapidly. The reversal is violent and sudden. Both produce trend reversals. Both can produce substantial moves. But the trader's approach to each differs significantly: For rounding patterns, students wait patiently through the formation, watch for the neckline breakout, and enter on that breakout with a measured-move target. For V-reversals, students watch for the capitulation candle followed by a hammer or similar reversal candle, then enter on the next session's bullish confirmation. The timing window is short — V-reversals don't wait for patient confirmation. If a student waits for a head-and-shoulders-style structural confirmation, the V-reversal will have completed before they can act.
When a student sees a downtrend with bodies that are getting progressively larger rather than smaller, accompanied by what looks like climax-volume selling, they should specifically watch the next 1-3 sessions for a hammer, dragonfly doji, or bullish engulfing pattern. If any of these appears at the climax low, the probability of a V-reversal is high. The combination of capitulation candle plus immediate reversal candle is one of the highest-quality setups in the entire candle-plus-chart-pattern vocabulary.
Combined Chart — V-Bottom into Uptrend into Double Top
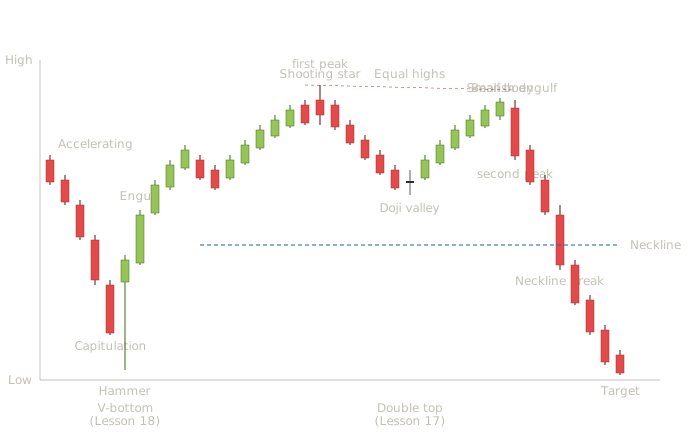
Reading the combined chart through both layers This chart shows a complete trading cycle — the kind of multi-month price action your students will encounter constantly in real markets. The first half traces a V-bottom from Lesson 18; the second half traces a double top from Lesson 17. Both patterns appear with their integrated candle signals at the critical structural moments. The accelerating decline (candles 1-5). Five bearish candles drive price lower with progressively expanding bodies. The fifth candle is the climactic session — a long bearish marubozu-like candle that pushes price to the chart's low with minimal lower shadow. The candle-body trajectory from Lesson 18 reads as building panic rather than fading momentum. Students should recognize this as the warning that capitulation is approaching. The capitulation low and hammer reversal (candles 5-6). The capitulation candle is followed immediately by a long-legged hammer — small body near the top of the range, extended lower shadow that probes even deeper into the panic before buyers absorb the selling and rally the close back up. This is the V-reversal turning point. The next candle confirms decisively with a bullish engulfing pattern: a long bullish body that completely engulfs the hammer's small body. Two reversal signals stacked back-to-back at the climax low — the highest-quality V-bottom configuration the candle-pattern vocabulary describes. The recovery rally (candles 7-15). Bullish candles drive price upward through what becomes the chart's middle phase. The rally is healthy — bodies of consistent moderate size, steady progression, brief pullbacks that resolve quickly back into the uptrend. This is what an uptrend looks like in the canvas-not-signal sense from Lesson 14. Each individual candle is not a signal; the aggregate is the trend. The shooting star at the first peak (candle 16). As price reaches a high, a candle forms with a small bearish body and an extended upper shadow — buyers pushed price aggressively higher during the session but couldn't hold the gains. This is the shooting star pattern from Lesson 3, appearing at exactly the kind of location where the four-dimension framework gives it high quality: extended prior rally, meaningful magnitude in the upper shadow, location at a new high. A student watching only candles would treat this as a tradeable reversal signal in its own right. The pullback to the neckline (candles 17-21). Five bearish candles drive price down toward the level that will become the neckline of the eventual double top. The decline is orderly, not panicked — moderate-bodied bearish candles with normal proportions. This is what a pullback within a developing topping pattern looks like. The doji at the valley (candle 22). When price reaches the neckline level, a doji forms. Indecision at this level marks the bottom of the intervening valley — the same structural feature we saw in Lesson 17's double-top anatomy. The doji isn't itself a reversal signal, but it marks the moment the decline pauses and reverses upward. The rally to the second peak (candles 23-28). Six bullish candles drive price back up toward the prior peak's level. Notice the candles get progressively smaller as the rally approaches the prior peak — strong rallies maintain or accelerate pace, while rallies that lose momentum approaching a known resistance level often fail. By the time price reaches the prior peak's level, the candle right before the second peak is notably small. This is the warning the chart pattern reader looks for: declining magnitude on the second rally suggests the rally won't push through the prior peak. The bearish engulfing at the second peak (candle 29). The small bullish candle just before the engulfing is the pause that precedes the reversal. The next candle opens above the small candle's close and then sells off dramatically, engulfing the prior body completely with a long bearish body. From Lesson 5, this is the bearish engulfing pattern — and it appears exactly at the prior peak's level. The chart pattern view sees the second peak of the double top completing with structural confirmation; the candle pattern view sees a reversal signal with ideal location and magnitude. Both views agree. The decline to the neckline (candles 30-32). Three bearish candles drive price down toward the neckline level. The candles get progressively larger — accelerating bearish pressure that mirrors the fading bullish pressure on the rally toward the second peak. This momentum asymmetry is itself a structural signal that the topping pattern is real rather than a temporary pause. The neckline break (candle 33). A long bearish candle breaks decisively below the neckline level — minimal lower shadow, large body, near-marubozu structure. This is the breakdown that confirms the double top pattern. Conservative shorts that waited for the neckline break enter here; aggressive shorts that entered at the bearish engulfing already have a meaningful position. The decline toward target (candles 34-37). Four more bearish candles drive price toward the measured-move target — the vertical distance from the peaks down to the neckline, projected downward from the breakdown point.
This is the kind of chart students need to internalize because real markets produce sequences like this constantly. Trends don't form in isolation; they're connected by reversal patterns. A V-bottom kicks off an uptrend; the uptrend exhausts into a topping pattern; the topping pattern initiates the next downtrend. Each phase requires different reading habits, and students who can shift between them have the multi-pattern vocabulary that real trading requires. The integration across lessons becomes visible. Students see candle patterns from Lessons 3, 5, and 6 (hammer, bullish engulfing, shooting star, bearish engulfing, doji) appearing at the precise structural moments where chart patterns from Lessons 17 and 18 predict they should appear. The two analysis systems are reading the same price action at different zoom levels, and the agreement between them is exactly what gives skilled traders confidence in their signals. The momentum-trajectory reading from Lesson 18 transfers to the double top. Notice how the accelerating bearish candles before the V-bottom capitulation have a mirror image in the decelerating bullish candles before the double top's second peak. Both are reading candle-body trajectory across many sessions rather than identifying a specific named candle pattern at a specific moment. This is the more advanced candle-level habit that ties chart-pattern analysis to candle-pattern analysis at a deeper structural level. The trading decisions get easier when both views align. A trader watching only candle patterns sees a shooting star at the first peak and a bearish engulfing at the second peak — two separate signals, each tradeable in its own right. A trader watching only chart patterns sees the double top forming and waits for the neckline break — one signal, late in the process. A trader watching both layers gets multiple sequential entry opportunities (the shooting star, the bearish engulfing, the neckline break, and the eventual retest of the broken neckline from below), each with different risk-reward characteristics. They can choose which entry suits their timeframe and risk tolerance because they understand all of them in context. The chart also shows what students will see on every timeframe. This sequence — V-bottom into uptrend into double top — happens on monthly charts over years, daily charts over months, and one-minute charts over hours. The patterns and signals are identical at every timeframe, as Lesson 14 established. Day traders watching one-minute charts see this exact sequence multiple times per week. Swing traders watching daily charts see it several times per year. Position traders watching weekly charts see it across multi-year cycles. The reading is the same.
The most valuable exercise after working through this chart is to find real instances of similar sequences on actual charts. Have students pull up daily charts of any liquid instrument and look for a V-bottom followed by sustained uptrend followed by a topping pattern. The instances won't be as textbook-clean as the illustration here, but they exist constantly. Real charts have additional noise, sometimes irregular candle behavior at the critical moments, occasional false signals that didn't follow through — but the underlying structure recurs. Students who can identify three real examples of this V-bottom-to-double-top sequence on charts they pull up themselves have made the transition from textbook learners to working traders. The pattern recognition is fluent enough that the noise of real markets doesn't obscure the underlying structure.
Pattern Statistics and Sources
Rounding bottom
| Attribute | Notes |
|---|---|
| Confirmation rule | Daily close above the neckline (the resistance level formed at the top edges of the saucer). Conservative entry waits for breakout confirmation; aggressive entry buys near the lower portion of the curve as higher lows become evident. |
| Volume signature | The classical signature is a U-shape mirroring the price action — heavy volume at the beginning of the decline, low volume at the curve's floor, rising volume during the advance with a surge on the breakout. |
| Reliability | Generally regarded as a respected reversal pattern when correctly identified, with the major caveat that it forms slowly and requires patience. |
| Common failure mode | The advance fails to reach the neckline and price returns to test the lows. Misidentification — students often label any vaguely bowl-shaped price action as a rounding bottom when the structure doesn't meet the formation-time and symmetry requirements. |
Cited statistics:
ChartGuys' data on the rounding bottom (saucer) reports an upward breakout frequency of approximately 66%, a failure rate of about 14%, an average rise after breakout of around 30%, a throwback frequency of about 58%, and a target met rate of approximately 65%.
LuxAlgo's review of research on rounding patterns shows rounding bottoms succeed about 66% of the time when price trends upward into the pattern. They note that patterns usually take 8 to 12 weeks to fully develop, with the volume behavior showing decreasing volume during the base and a surge at the breakout.
InvestingGoal's analysis notes that traders experience reduced accuracy when trading the rounding bottom in shorter timeframes due to wild short-term price fluctuations. The pattern is more reliable on higher timeframes such as daily or weekly charts.
Options Strategies Insider notes that although the pattern has a high success rate, it is significantly rarer than other technical analysis patterns. Breakout confirmation requires above-average volume and a close above the lip of the rounding bottom. The price target is calculated by measuring the distance between the highest high and the lowest low, then adding that to the breakout level.
Rounding top
| Attribute | Notes |
|---|---|
| Confirmation rule | Daily close below the support level formed at the bottom edges of the inverted dome. |
| Volume signature | The mirror — heavy volume during the initial rally, declining volume across the dome's formation, rising volume on the breakdown. |
| Reliability | Generally regarded as comparable to the rounding bottom in mirror, with the same caveat about patient development. |
| Common failure mode | Same as rounding bottom in mirror — failure to reach the neckline, misidentification of unrelated curving price action. |
Cited statistics:
ChartGuys describes rounding tops as reliable but frustrating because they develop slowly and offer little immediate excitement. Trading approaches include conservative shorts on confirmed breakdown below support, or aggressive shorts as the dome forms once lower highs become evident. The minimum target is the depth of the pattern projected downward from the breakdown point.
V-tops and V-bottoms
V-reversals are difficult to test statistically in the same way as structured patterns because they're defined more by behavior than by precise structural rules. Most reliability research either folds V-reversals into broader "spike" or "key reversal" categories or addresses them through related concepts like capitulation lows and climax volume.
| Attribute | Notes |
|---|---|
| Confirmation rule | A reversal candle (hammer, dragonfly doji, bullish engulfing for bottoms; shooting star, gravestone doji, bearish engulfing for tops) at the climax extreme, followed by strong follow-through in the next 1-3 sessions. The reversal candle alone isn't enough — the speed of the follow-through is what distinguishes V-reversal from a brief bounce within a continuing trend. |
| Volume signature | Exceptionally heavy volume at the climax — climax volume — followed by sustained volume during the reversal. V-reversals on light volume often fail because they lack the capitulation that drives the pattern. |
| Reliability | Genuine V-reversals — those marked by climax volume, exhaustion candles, and immediate reversal candles — are generally regarded as among the strongest signals available. The challenge is identification in real time, not reliability after correct identification. |
| Common failure mode | False capitulation. Price drops sharply, prints what looks like a hammer or engulfing reversal, then continues lower within a few sessions. Without climax volume and immediate strong follow-through, what looked like a V-reversal was actually a brief bounce within an ongoing trend. |
Because V-reversals are behavior-defined rather than structure-defined, students will find fewer hard reliability numbers than for structured patterns like double tops or head and shoulders. The right framing for students is qualitative: V-reversals work powerfully when they work, but identifying them correctly in real time is the entire skill. Students should weight their reading toward the candle-level signals (capitulation candle plus immediate reversal candle plus climax volume) because those are the practical identification criteria.
Multi-source pool
For students who want to dig deeper into rounding pattern and V-reversal statistics:
- thepatternsite.com (Bulkowski) — rounding bottom and rounding top entries with reliability rankings and average post-breakout moves.
- chartguys.com — specific reliability figures with throwback rates and target-met rates.
- stockcharts.com ChartSchool — structural descriptions with volume signature analysis.
- luxalgo.com — research aggregation across multiple sources.
- Edwards and Magee's Technical Analysis of Stock Trends — foundational descriptions of rounding patterns and key reversal days (the precursor concept to V-reversals).
- Academic literature via Google Scholar — search terms include "rounding bottom technical analysis" and "capitulation reversal trading."
Common Student Mistakes with These Patterns
Rounding patterns require an extended prior trend, a meaningful formation period (typically 8-12 weeks on daily charts), and reasonable symmetry across the curve's midpoint. Three weeks of mild oscillation in a sideways range isn't a rounding bottom; it's just sideways price action.
This is the most common rounding-pattern mistake. The pattern's character is gradual transition, not sharp turning points — there is no specific moment at the curve's floor that constitutes "the entry." Students who try to identify the exact bottom typically enter too early on multiple occasions during the curve's formation, accumulating losses against a level that may still have lower to go. The disciplined entry is on the neckline breakout, not at the curve's floor.
A bounce after a long decline isn't a V-reversal — it's a bounce. V-reversals require climax-volume capitulation, a clear reversal candle, and immediate strong follow-through. Without those three elements, what looks like a V-reversal is more likely a bear-market rally that will resolve back to lower lows. Students need patience to confirm all three elements before treating a bounce as a true V-reversal.
A hammer in the middle of a downtrend is a candle pattern with the four-dimension quality framework. A hammer at a capitulation low with climax volume is a structurally different signal — much stronger. Students should distinguish between the two: hammers at random lows deserve normal candle-pattern treatment; hammers at climax-volume capitulation lows deserve much higher conviction because the chart-level context dramatically strengthens the candle-level signal.
The flip side of the V-reversal mistake. Students who learn from textbook examples of head and shoulders or double tops can develop expectations that all reversals look dramatic. Rounding patterns reverse quietly — there's no single moment of structural confirmation, just a gradual shift across many sessions. Students need to train themselves to recognize patient, undramatic reversals as legitimate signals, not as the absence of signals.
How This Lesson Connects to What Comes Next
That completes the reversal pattern family. Lessons 16, 17, and 18 collectively cover the major Western reversal patterns: head and shoulders, double tops and bottoms, rounding tops and bottoms, and V-shaped reversals. Students who've worked through all three lessons now have a complete toolkit for identifying when an existing trend may be ending — through sharp structural breaks (head and shoulders, double patterns), through gradual transitions (rounding patterns), or through violent capitulation (V-reversals).
Lesson 19 begins the continuation pattern family with triangles — symmetrical, ascending, and descending. Where reversal patterns signal that trends are ending, continuation patterns signal that trends are pausing before resuming. The interpretive logic is different and students often find continuation patterns harder to trade because they require holding through what looks like a reversal while waiting for the trend to resume. The candle-pattern integration approach we've been building helps significantly here — within continuation patterns, certain candle signals distinguish healthy pauses from genuine reversals.
Lessons 20 through 22 complete the continuation patterns and lesser-known formations. Lesson 23 builds the chart pattern interpretive framework parallel to Lesson 12 for candles. Lesson 24 is the synthesis lesson where all the integration we've been doing across this section gets formalized into a complete multi-timeframe analysis approach.
Quiz — 3 Questions
Answer one at a timeThe lesson describes a key candle-level difference between the floor of a rounding bottom and the second trough of a double bottom. How is the rounding bottom's curve floor marked at the candle level, and why is it different from a sharper reversal?
In this lesson
300 — Western Chart Patterns — Structure, Candle Integration, Statistics